On September 10, 2025, during a public event at Utah Valley University, a young man's life was forever altered. Tyler Robinson now faces the death penalty. But a meticulous frame-by-frame forensic analysis of multiple eyewitness video recordings reveals physical evidence that demands closer examination.
This independent investigation applies computational pixel flow analysis, dense optical flow mapping, multi-angle stereo acoustic analysis, audio-visual source distance computation, gas release imaging, and physical evidence examination to reconstruct what the video evidence actually shows.
>15.6 J
Minimum energy at epicenter
Computed from necklace kinetics, component velocities, and shirt deformation work. Exceeds a single LiPo thermal runaway, suggesting a triggered cascade.
429–461ms
Delay to bleeding onset
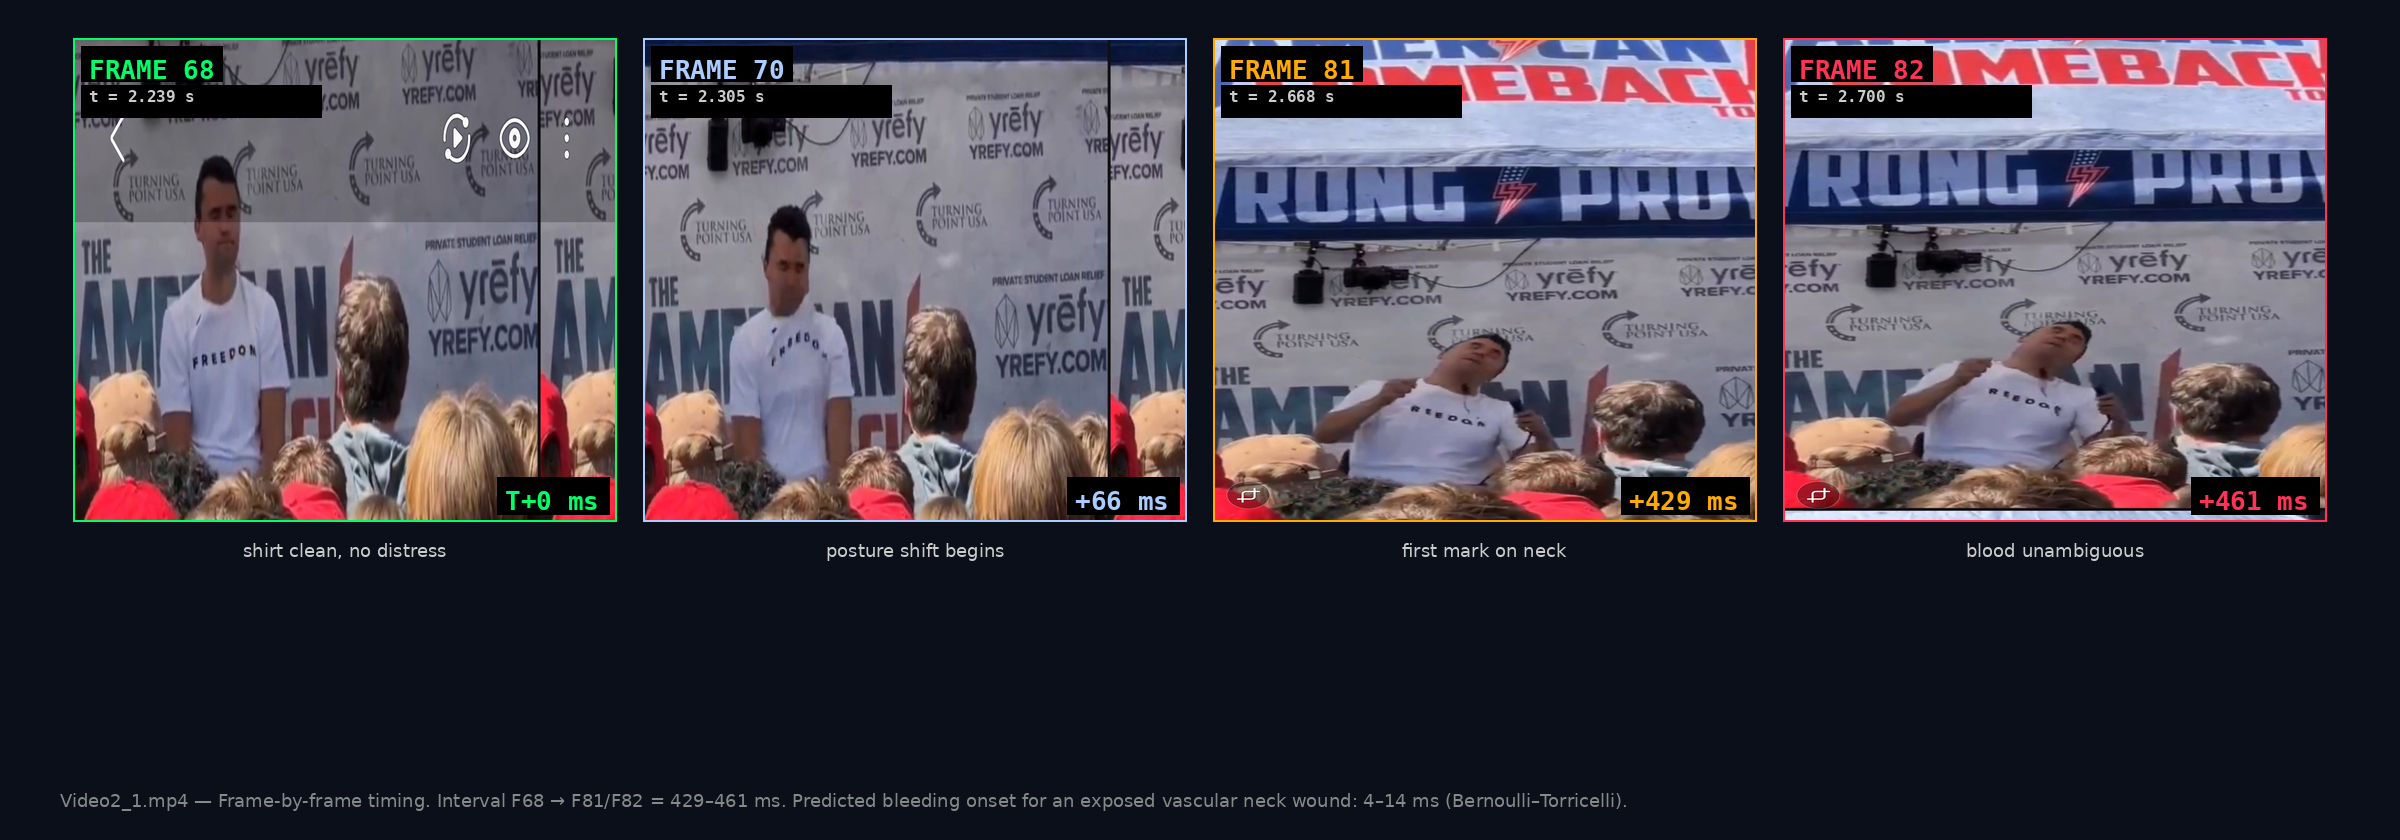
Frame-by-frame analysis of video2_1.mp4: first observable shirt movement at Frame 68 (t=2.239s), first visible blood at Frame 81–82 (t=2.668–2.700s). 30× to 110× longer than Bernoulli–Torricelli physics predicts for an exposed vascular neck wound.
(775, 562)
Epicenter pixel coordinates
Dense optical flow identifies the peak motion epicenter at the precise location where the RØDE Wireless PRO transmitter was clipped to the victim's shirt.
Gas → Motion
Temporal sequence
Video shows gas escaping the collar one frame before mechanical displacement. Gas-first, mechanics-second is a hallmark of an internal energetic event.
Video Exhibit — Physical Evidence
The shirt, the necklace & the microphone
A detailed video walkthrough of the three physical components at the center of this analysis: the shirt and collar, the metal necklace, and the RØDE Wireless PRO microphone with its magnetic clasp. The video steps through how each item was worn and positioned, and what the frame-by-frame record shows.
The critical event unfolds across a handful of video frames. At 30fps, each frame captures ~33.3ms. Within this window, a cascade of physical events occurs in a forensically significant temporal order.
Frame N — T+0ms
Gas Release
Faint gas visible escaping from the front shirt collar. No mechanical deformation yet. This indicates pressurization from a gas-generating event beneath the shirt — consistent with LiPo thermal runaway products.
Frame N+1 — T+33ms
Explosive Shirt Deformation
Dramatic rapid deformation. Back right collar expands. Front panel inflates. Metal necklace snaps and launches upward at 21+ m/s (47+ mph), requiring ~6.8 joules of kinetic energy.
Frame N+1 to N+2
Component Ejection
The RØDE circuit board (30mm × 28mm) traverses the shirt interior at high velocity, pulling the collar up. Battery follows toward the neck. Magnetic clasp lags behind on the same trajectory.
T+0.429 to T+0.461 seconds
Bleeding Onset
Frame 68 (t=2.239s) marks first observable shirt movement. First visible blood appears at Frame 81 (t=2.668s, first mark) to Frame 82 (t=2.700s, unambiguous). 13–14 frame interval at 30 fps. Bernoulli–Torricelli flow from a carotid or jugular wound predicts visible blood within 4–14 ms; the observed delay is 30× to 110× longer. See Section 15 for full hydrodynamic analysis.
Preceding bleeding
Decorticate Posturing
Decorticate posturing appears within frames of initial deformation, ~0.4 seconds before the neck wound. This sequence suggests brain injury preceded neck trauma.
Section 03 — Gas Release Analysis
Imaging the invisible
CLAHE enhancement, high-pass filtering, and false color rendering reveal gas escaping from the shirt collar in the frame immediately preceding mechanical deformation. These techniques make visible what the naked eye cannot see.
Enhanced Visible
False Color Gas Visualization
Blue-purple regions represent shirt fabric. Red-orange zone at the collar junction shows the deformation boundary. Gas is visible escaping the collar opening as distinct color gradients.
High-Pass Filter
Thermal-Style Deformation Map
High-pass filtering isolates rapid intensity changes consistent with gas movement and fabric stress. Bright structures trace the collar deformation pattern and directional gas flow from beneath the shirt.
CLAHE Residual
Adaptive Contrast Enhancement
CLAHE reveals detail in shadows and highlights simultaneously. Amber-purple rendering exposes fabric stress patterns, fold lines under pressure, and the spatial extent of gas-driven deformation.
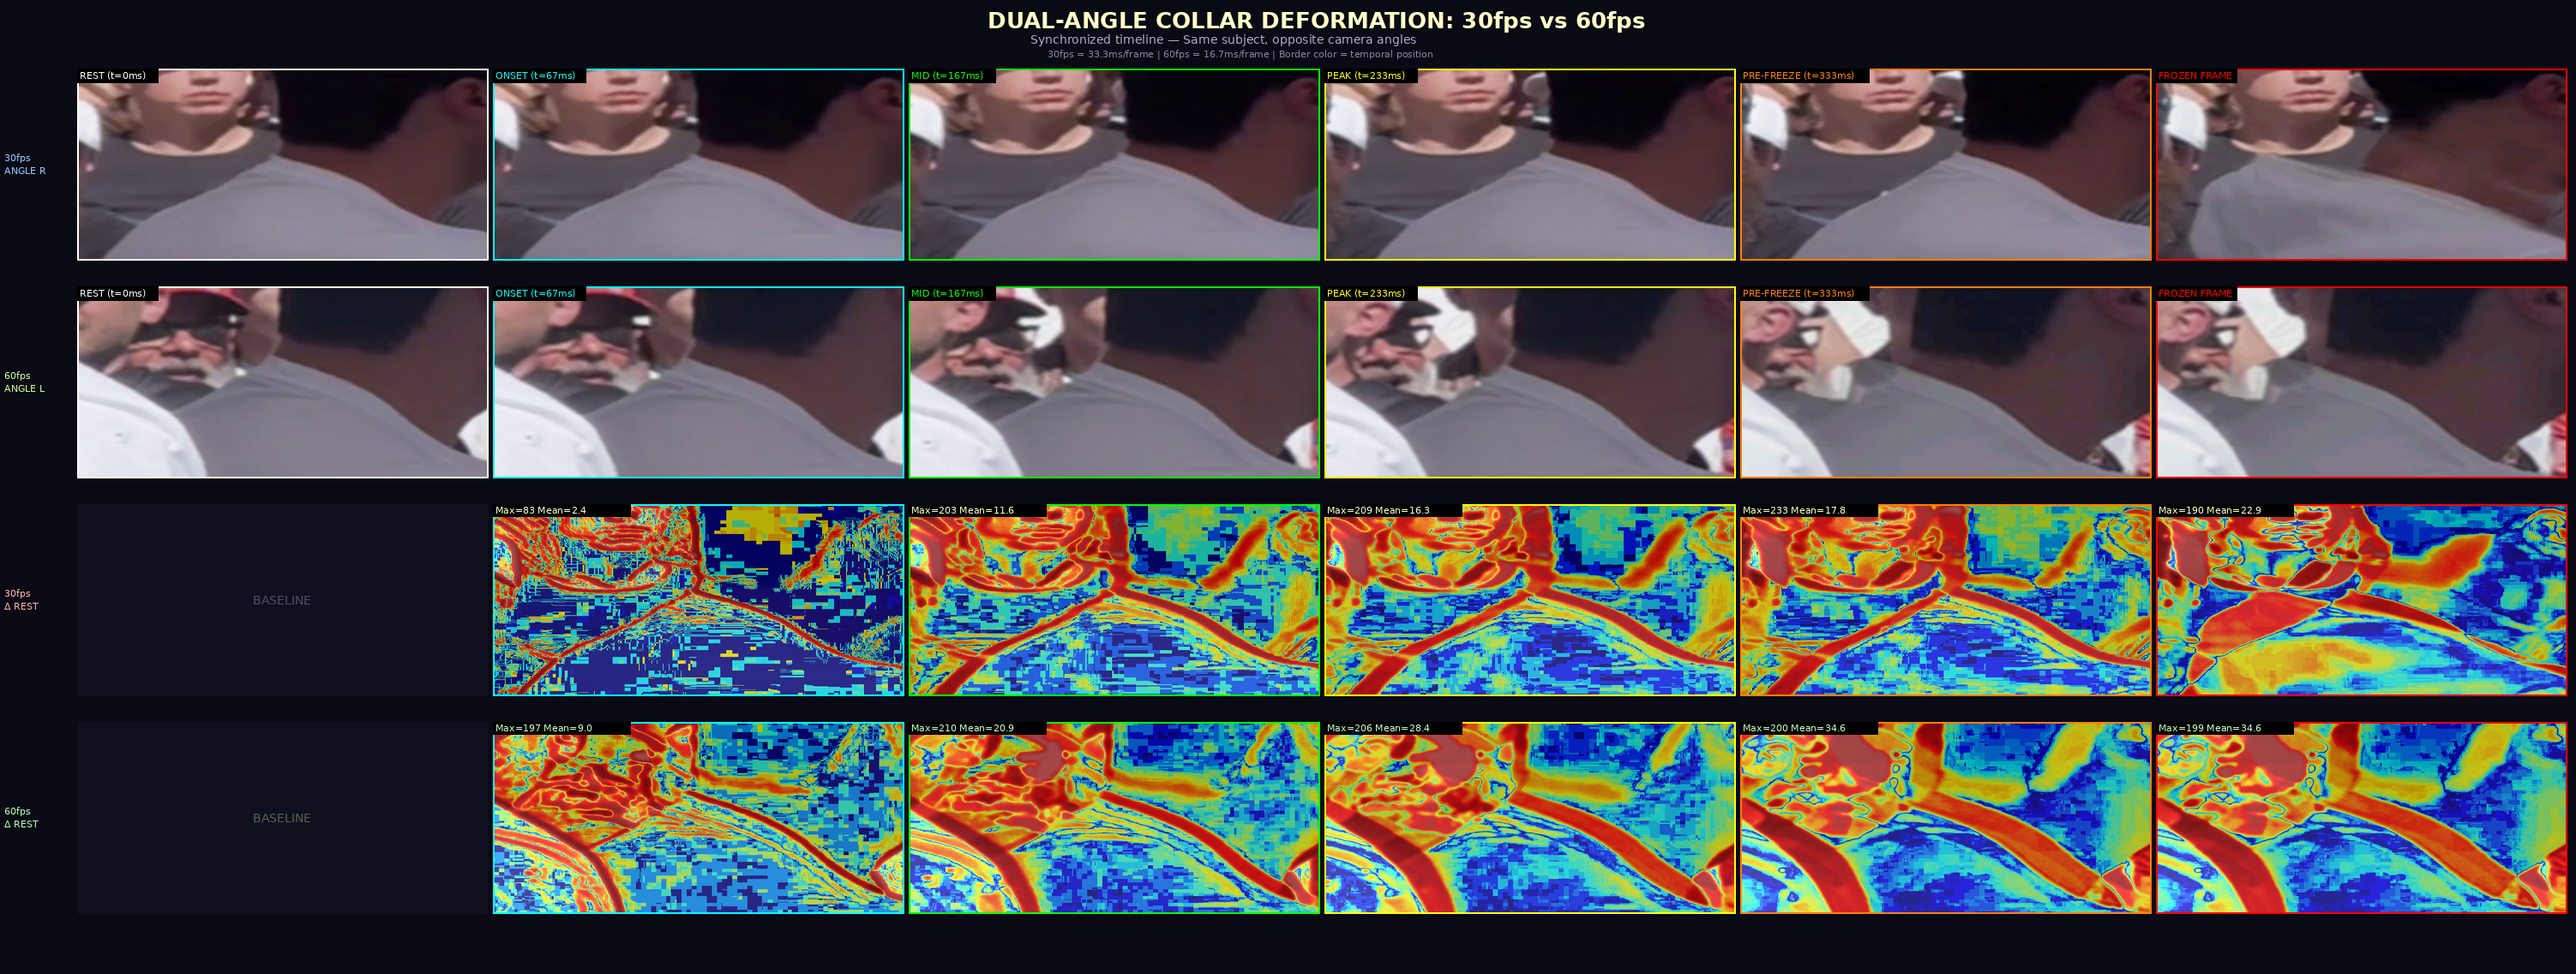
Multi-Angle
Dual-Camera Collar Comparison
Multiple eyewitness angles independently confirm collar deformation originates from the same spatial point — the RØDE transmitter location — corroborating single-epicenter theory across viewpoints.
SECTION 04
Circuit Board Identification
Spectral color analysis, dimensional measurement, and video evidence confirm the object trapped in the shirt collar is consistent with the RØDE Wireless PRO circuit board.
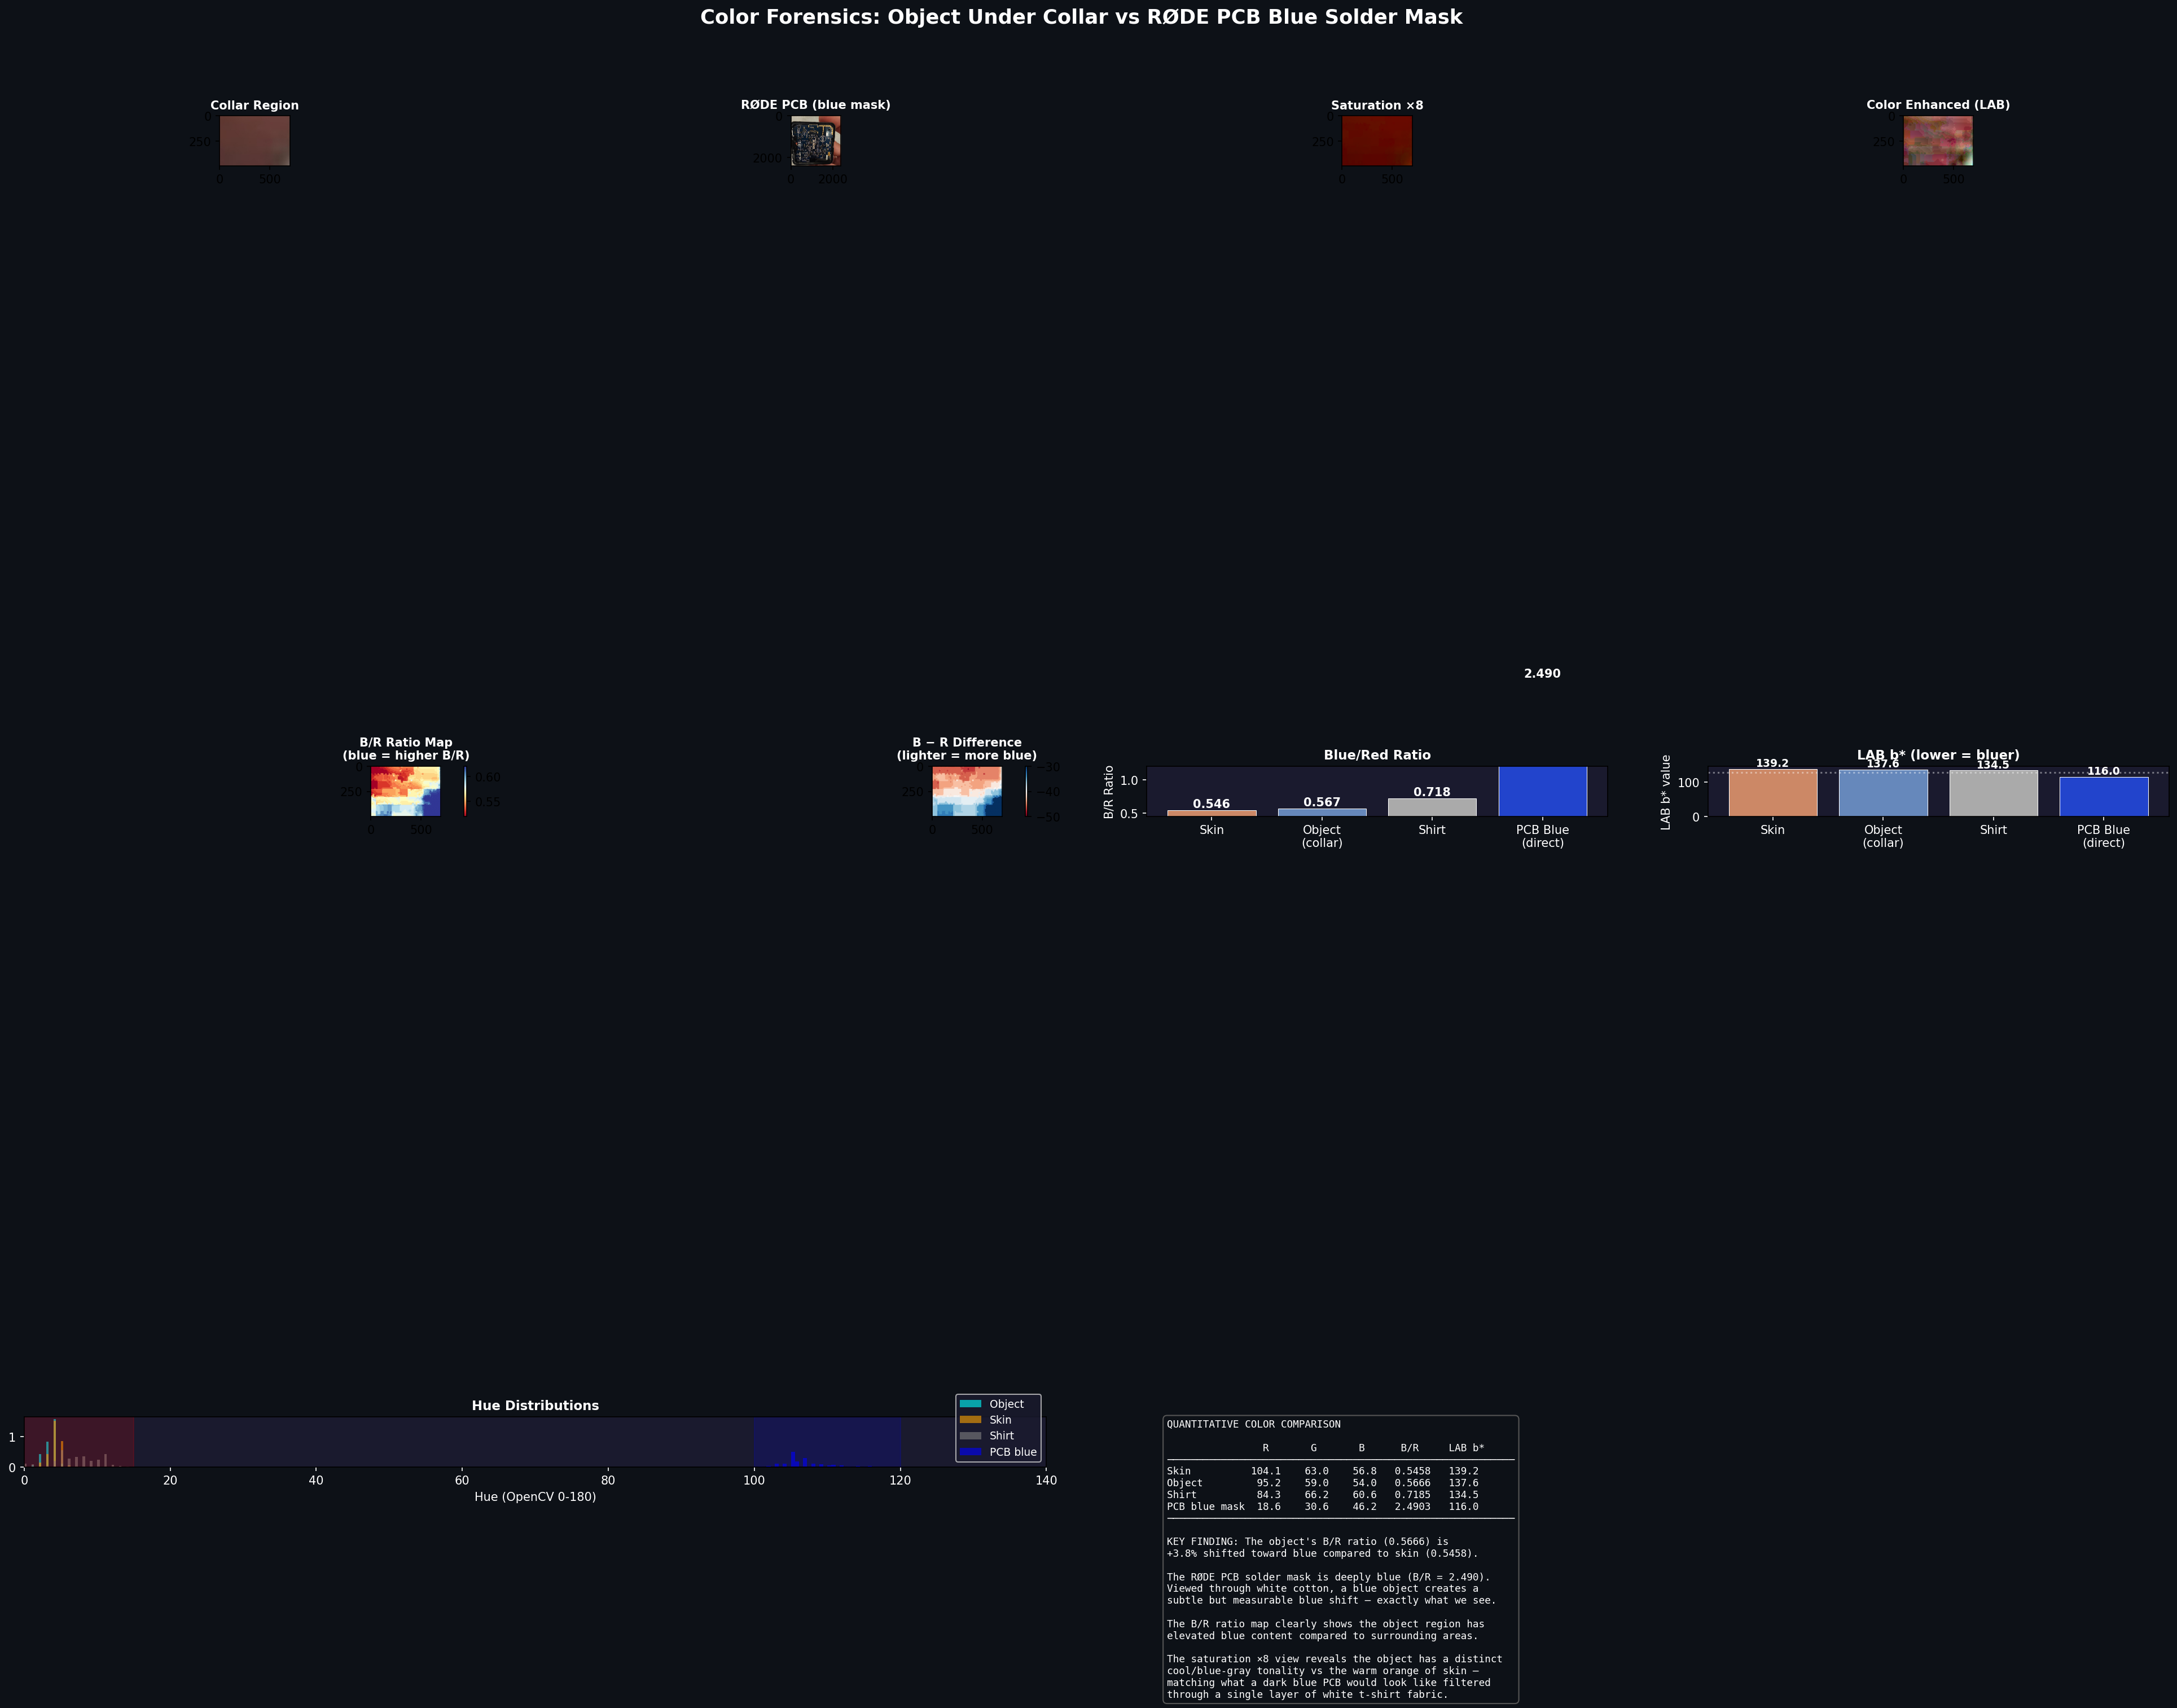
Blue Color Shift Analysis
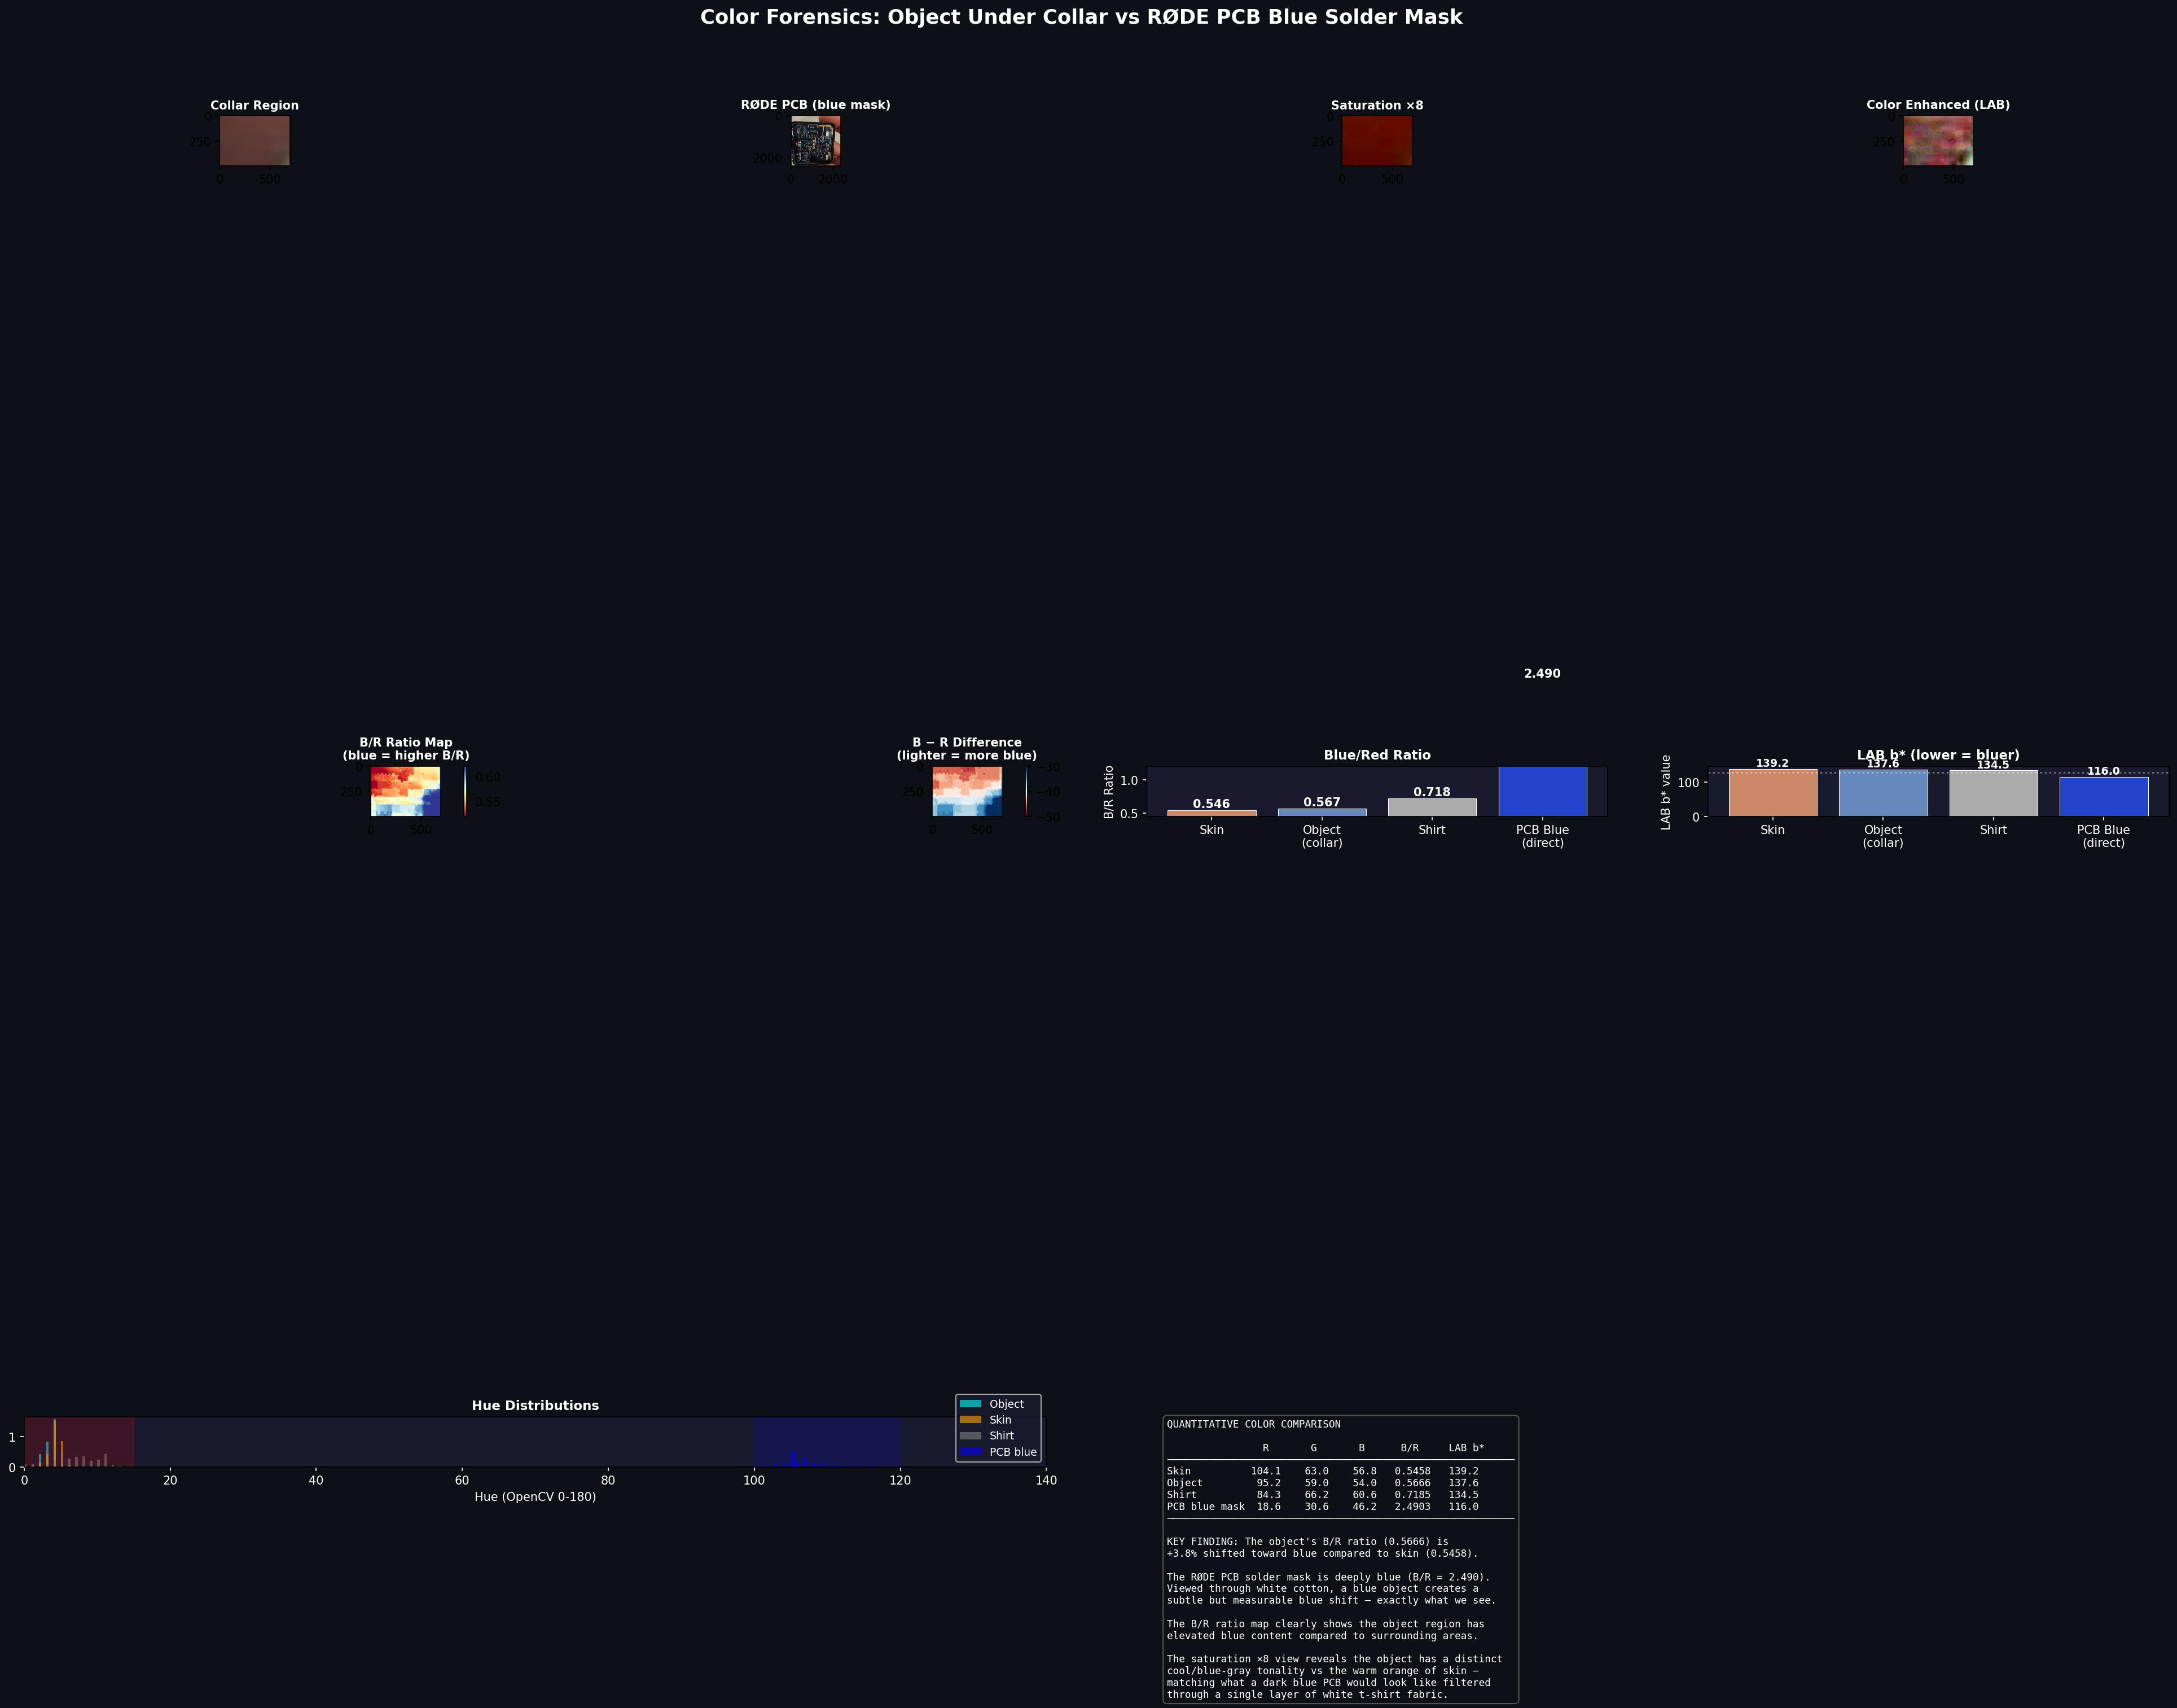
The RØDE Wireless PRO circuit board has a blue solder mask with a Blue/Red ratio of 2.490. When viewed through a single layer of white cotton t-shirt fabric, this blue signature is attenuated but remains measurably detectable through quantitative color analysis.
+3.8%
B/R RATIO SHIFT vs SKIN
Object: 0.567 → Skin: 0.546
1.6
LAB b* SHIFT TOWARD BLUE
Object: 137.6 → Skin: 139.2
2.490
PCB BLUE MASK B/R RATIO
R:18.6 G:30.6 B:46.2
The object region under the collar has a B/R ratio +3.8% higher than bare skin — a statistically significant blue shift within the compressed dynamic range of the source video. The LAB b* channel confirms: the object scores 1.6 units closer to blue on the blue-yellow axis than surrounding skin. The shirt fabric itself sits at B/R 0.718 (white cotton has a natural slight blue transmission bias), but the object area exceeds both skin and plain shirt values, indicating an additional blue source underneath. The hue distribution shows subtle blue contamination — not enough to move the peak, but enough to shift the ratios measurably. This is exactly what a dark blue PCB solder mask would produce when filtered through a single layer of white cotton.
QUANTITATIVE COLOR FORENSICS — B/R ratio maps, LAB b* comparison, hue distributions, saturation ×8 enhancement
Dimensional Analysis — Magnetic Clasp Scale Reference
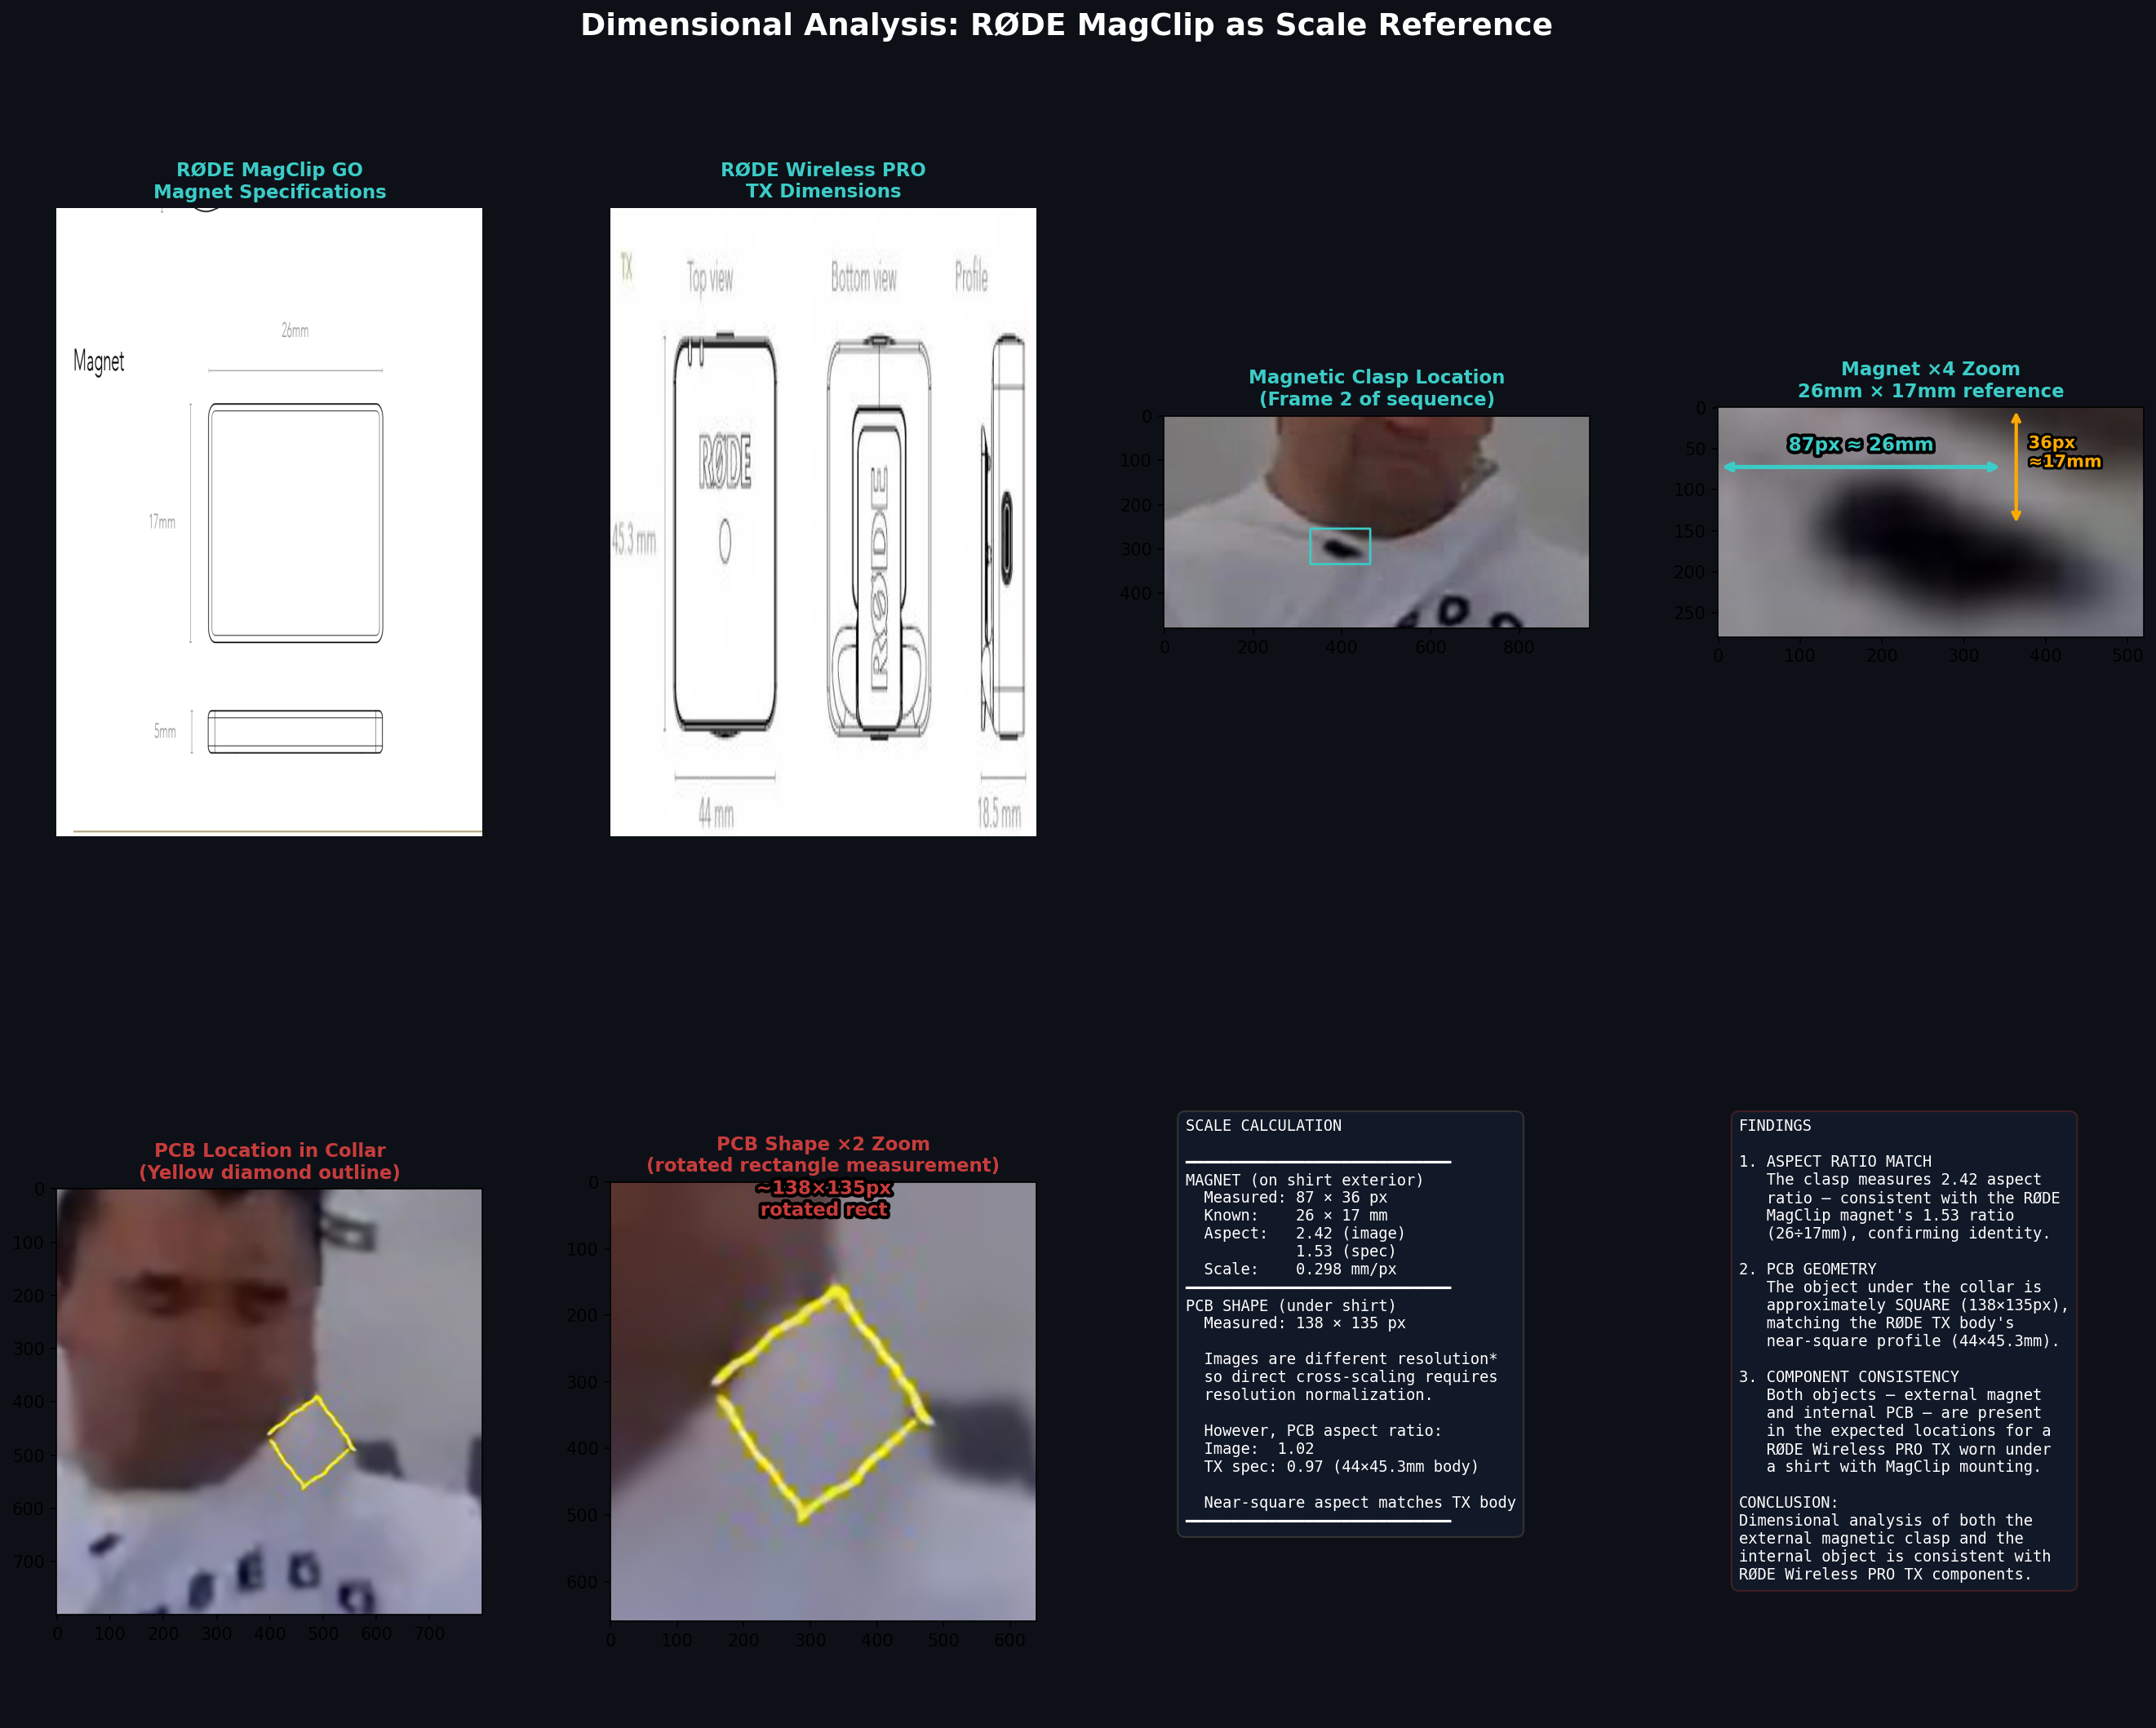
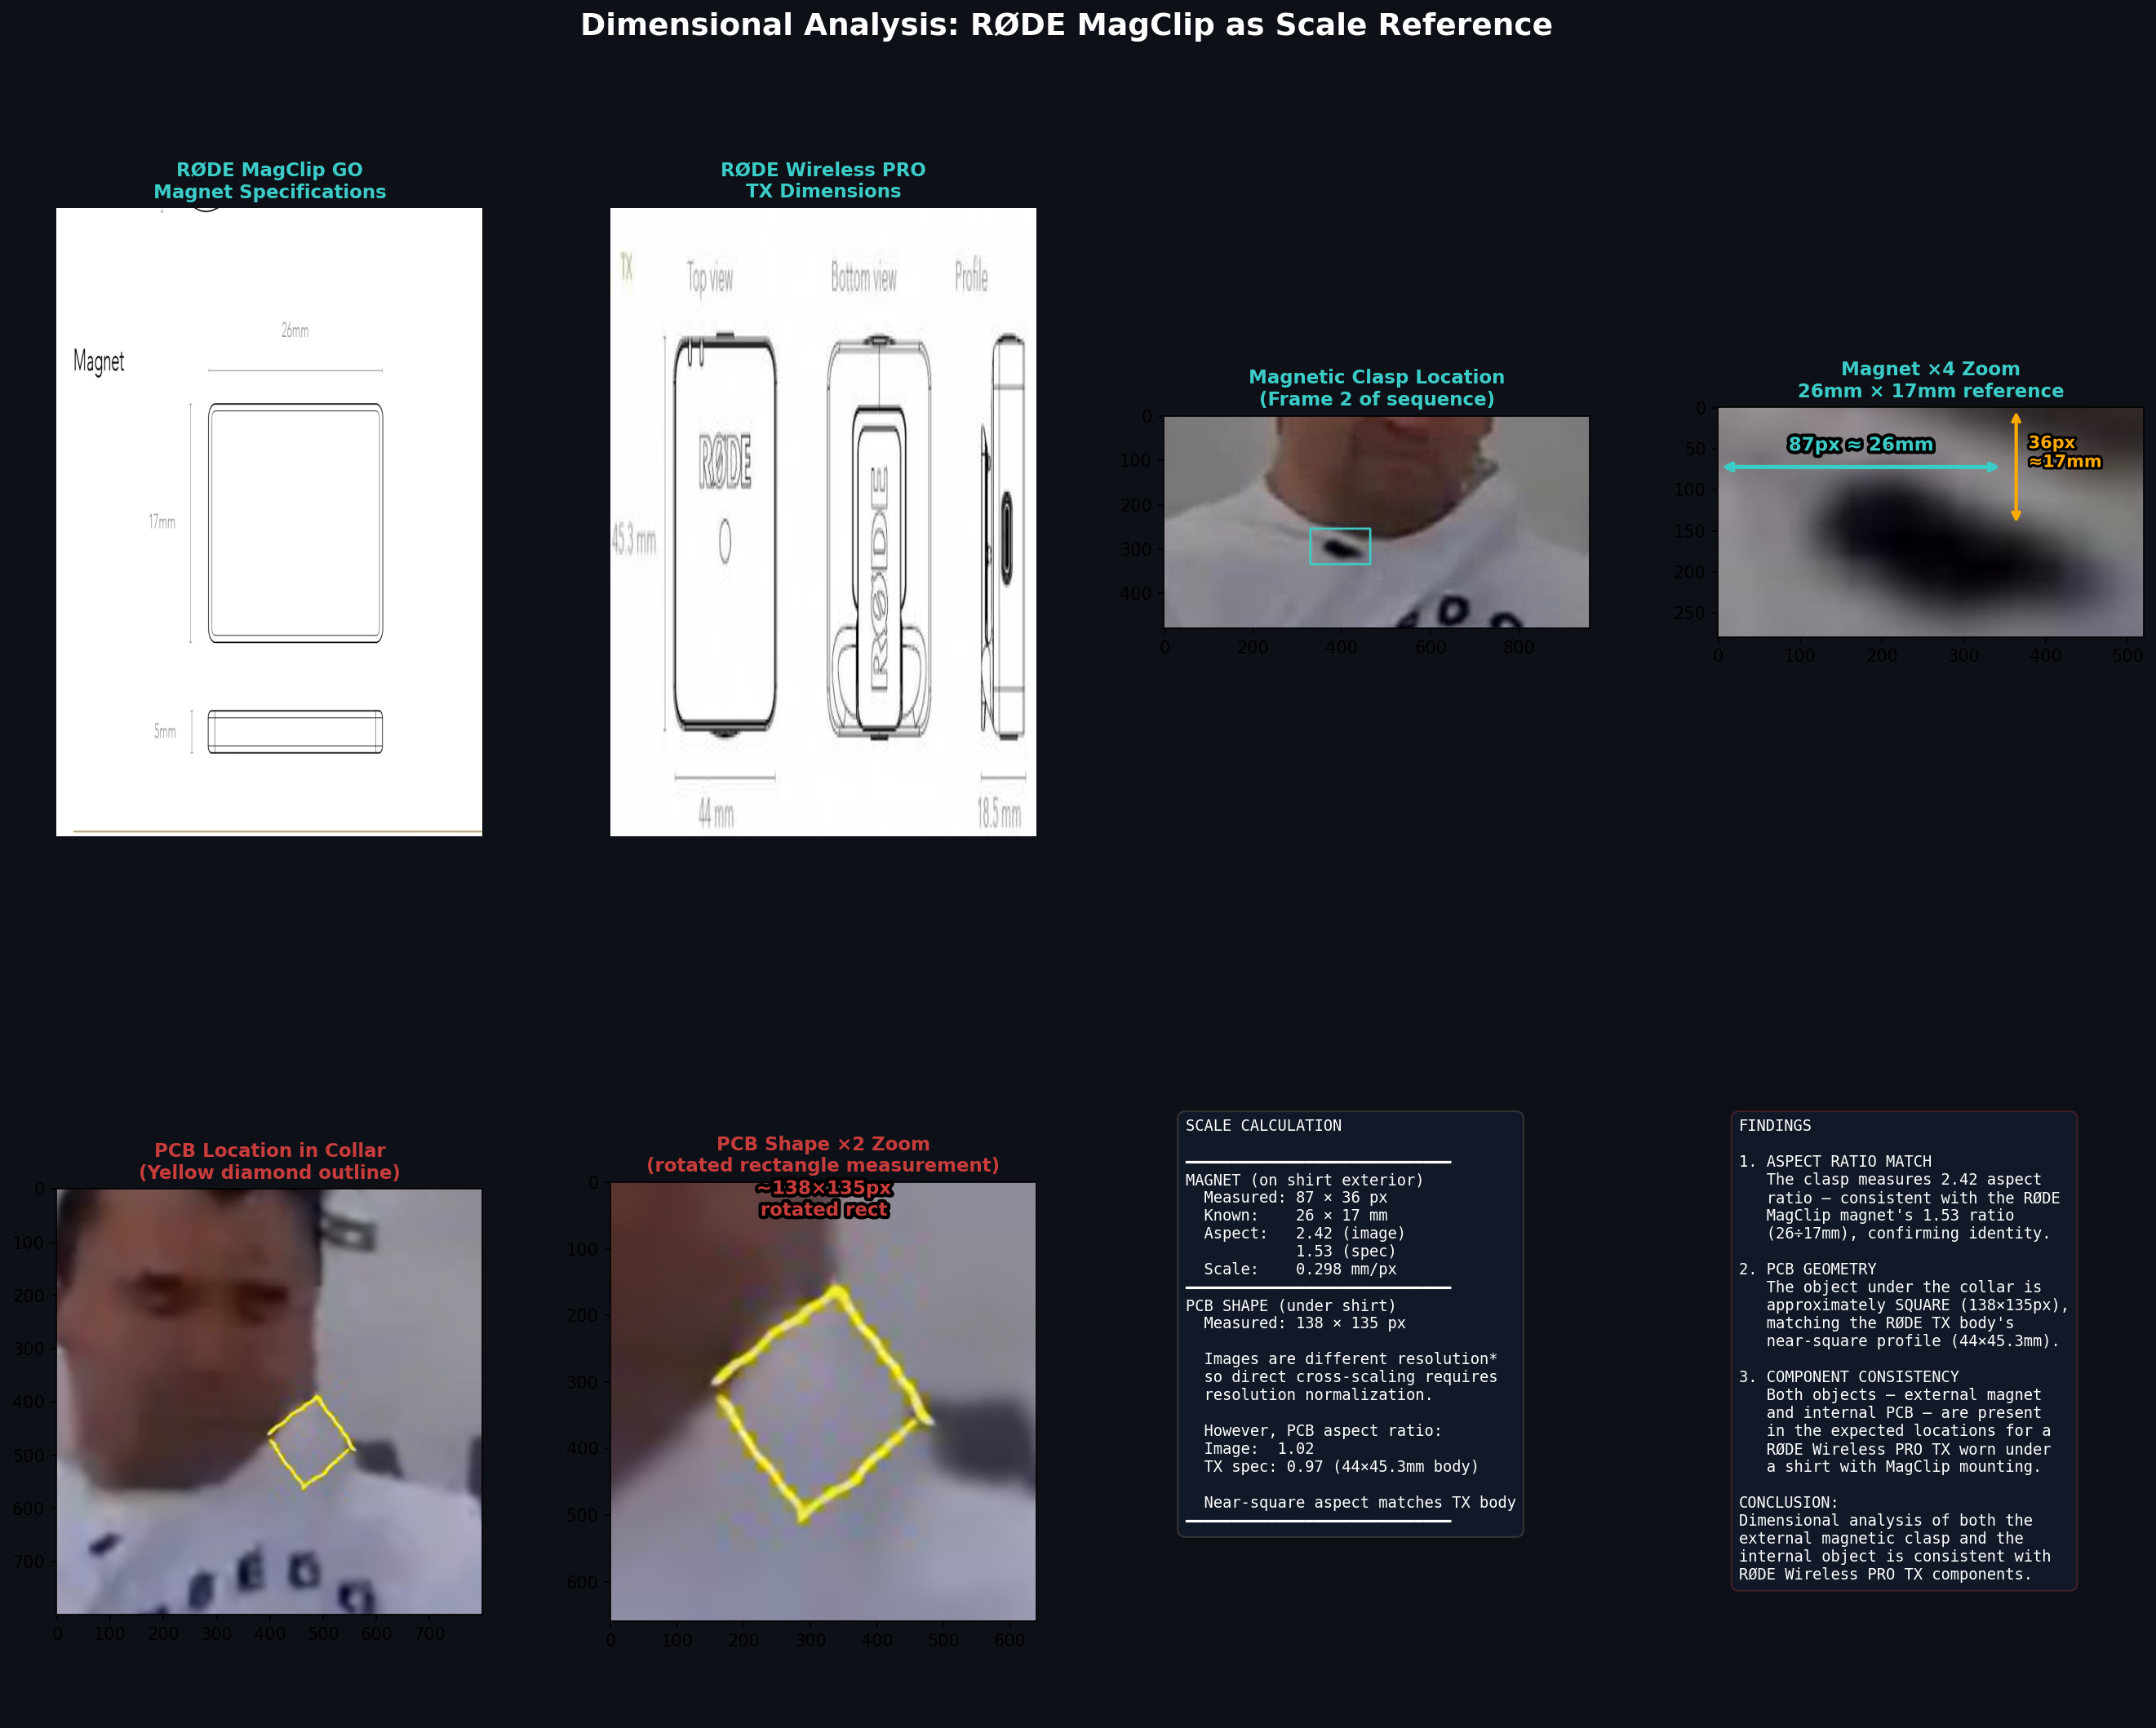
The RØDE Wireless PRO magnetic clasp is visible on the exterior of the shirt in frames immediately following the energetic event. The MagClip GO magnet piece measures 26mm × 17mm × 5mm per RØDE specifications, and the TX body measures 44mm × 45.3mm. As precisely manufactured components with known dimensions, they provide a direct physical scale reference. The object outlined under the shirt collar measures near-square at approximately 138 × 135 pixels (aspect ratio 1.02), closely matching the TX body's near-square profile (aspect ratio 0.97).
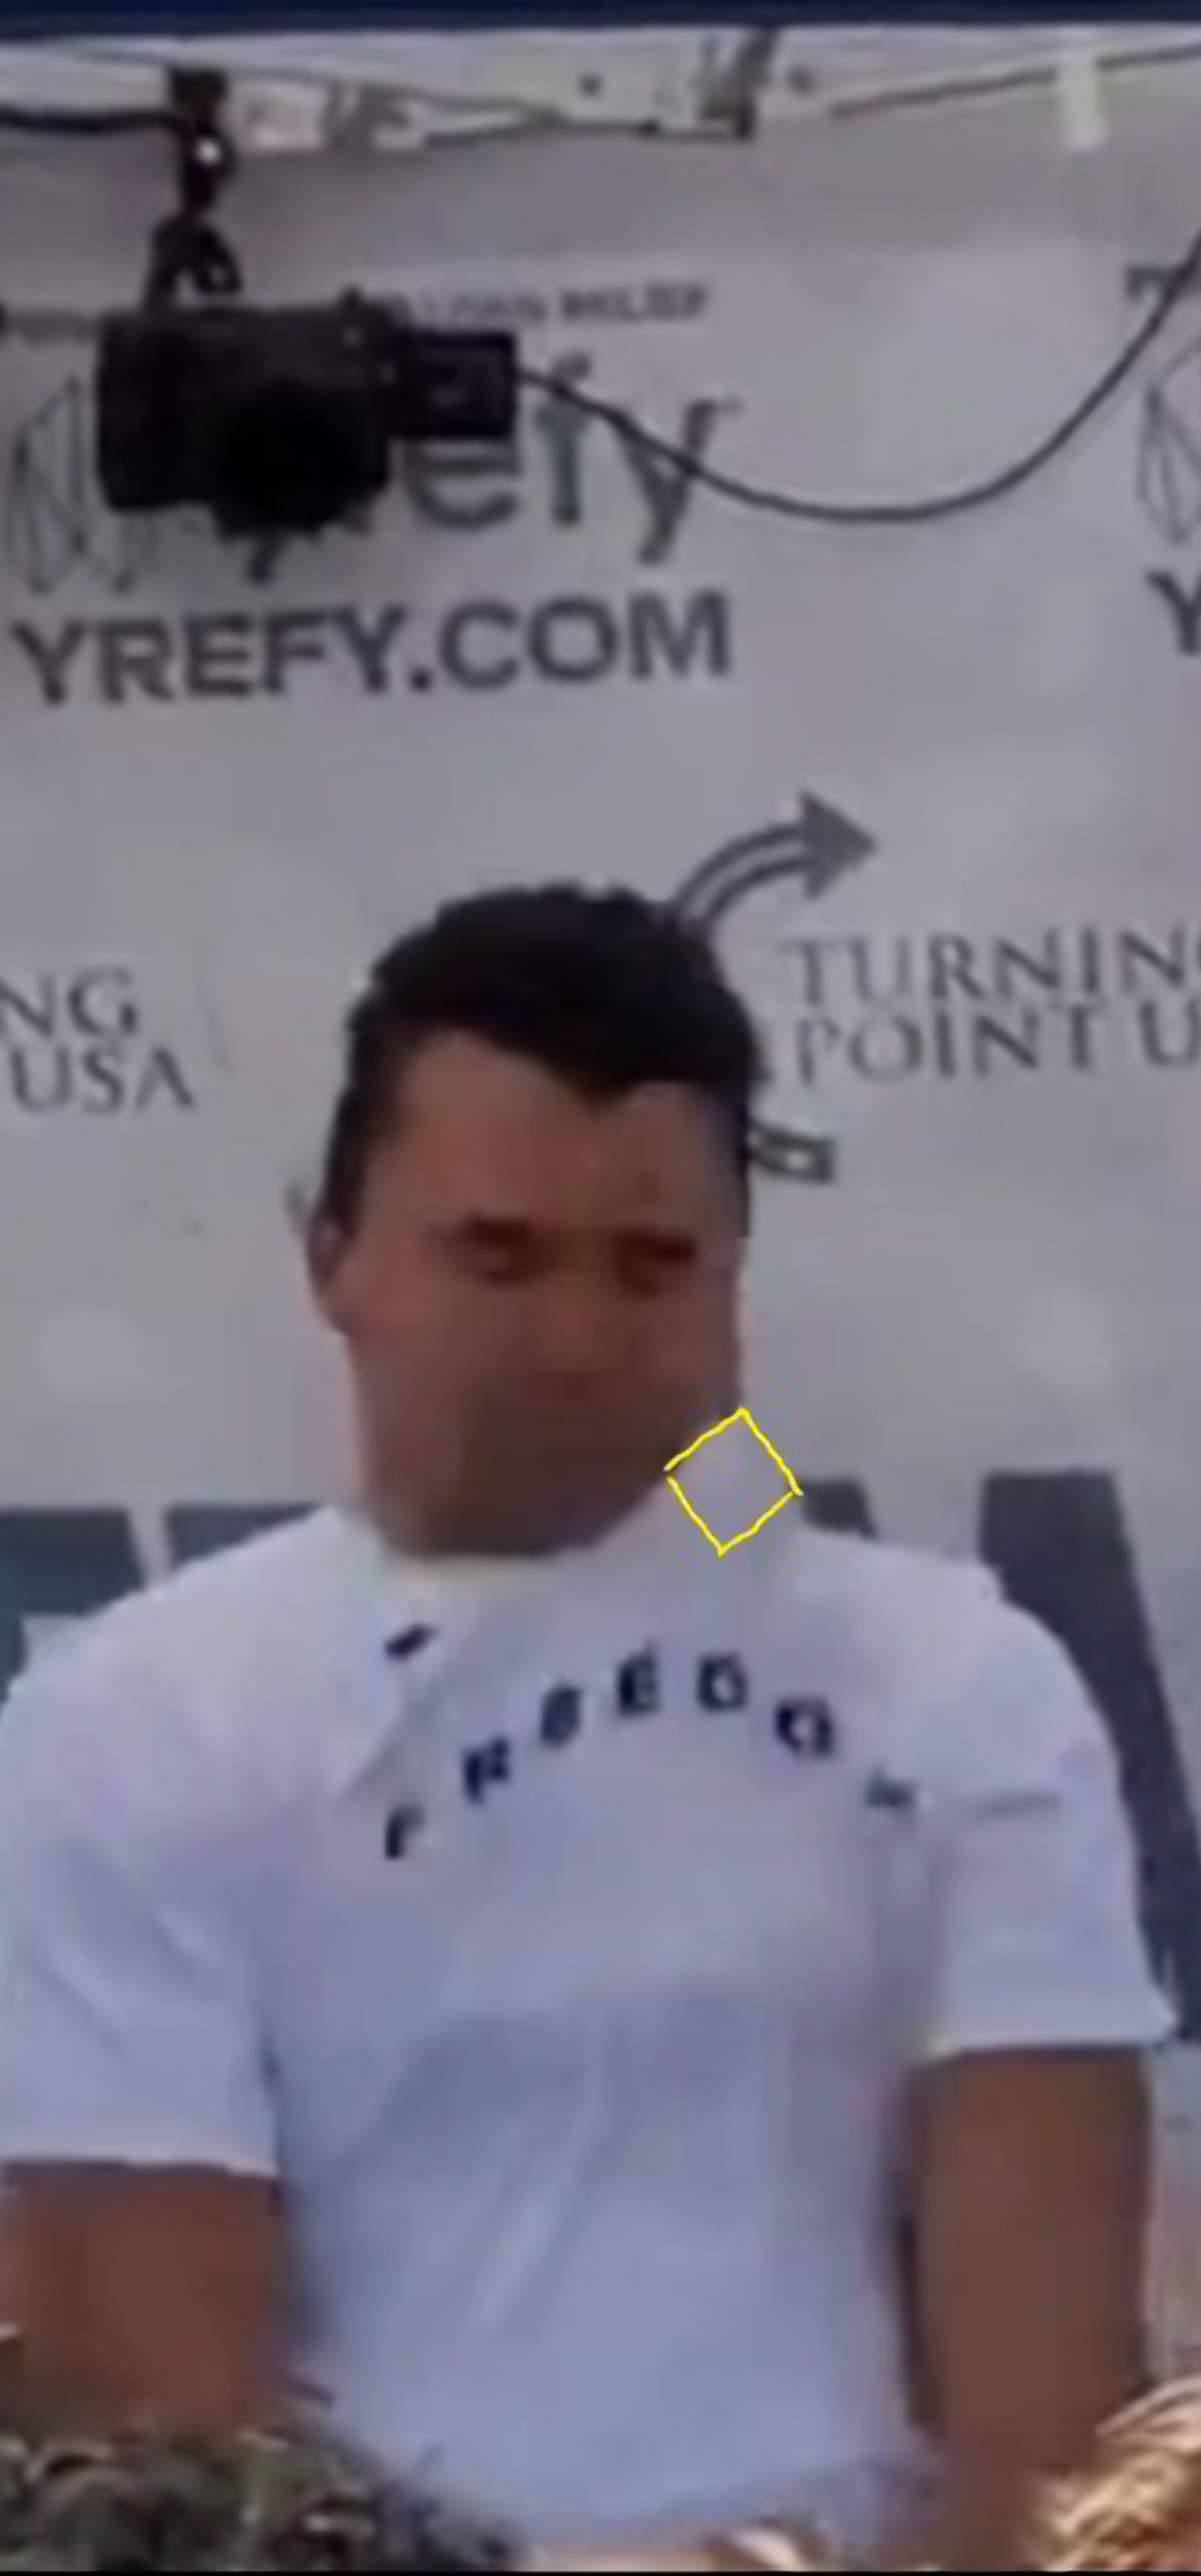
Yellow annotation outlines the rectangular circuit board shape caught in the shirt collar. The board's angular geometry is distinct from any natural fabric fold or skin contour. The object's position and orientation are consistent with the PCB being ejected from the transmitter housing and lodged momentarily in the collar during transit.
YELLOW OUTLINE: PCB GEOMETRY THROUGH WHITE COTTON
Circuit Board Falls Inside Shirt
Slow-motion footage captures the circuit board sliding downward inside the shirt as the collar retracts. After being momentarily caught in the stretched fabric, the PCB loses its hold and falls — confirming the object's presence inside the garment and its trajectory from the transmitter mounting point.
SLOW MOTION — PCB DESCENDS INSIDE SHIRT AFTER COLLAR RETRACTS
Magnetic Clasp Tracking Sequence
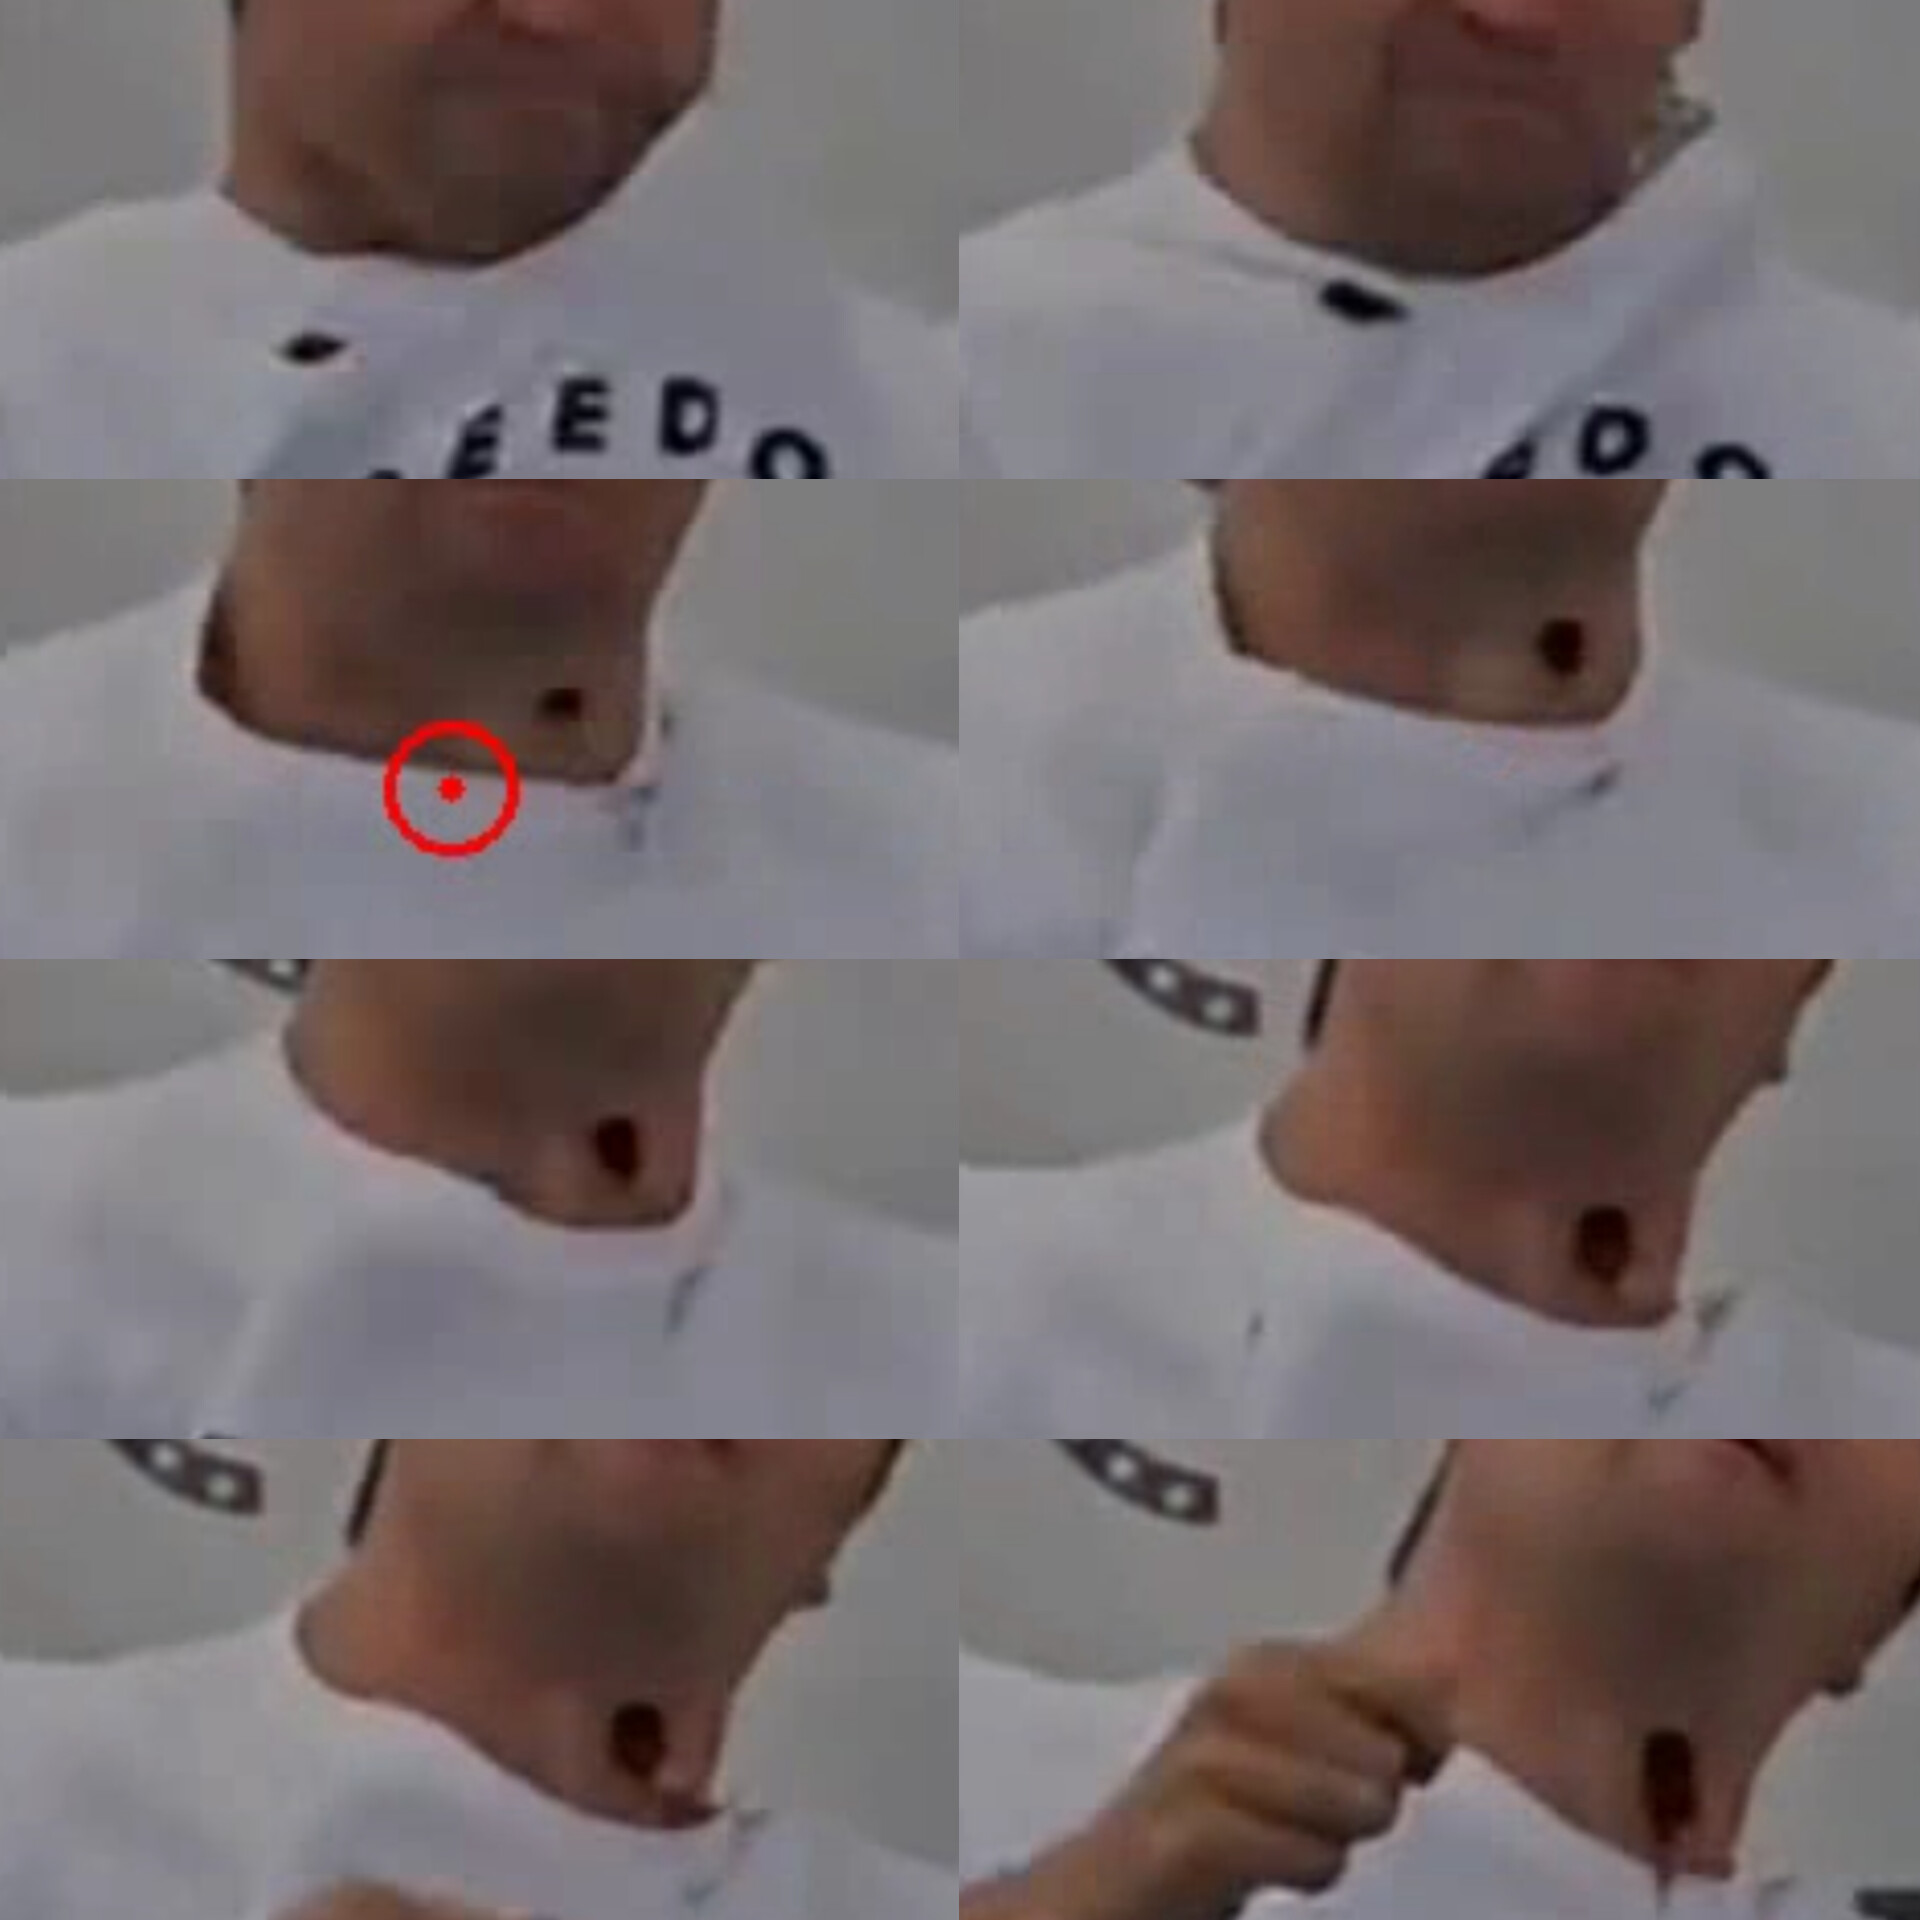
Sequential frame captures showing the RØDE magnetic clasp on the exterior of the shirt. The clasp, which held the microphone in place from the outside, is visible as a black rectangular object in the first two frames before being obscured by shirt movement. Its trajectory lags behind the internal PCB and battery, consistent with being magnetically coupled to the transmitter through the fabric.
8-FRAME SEQUENCE — MAGNETIC CLASP VISIBLE IN FRAMES 1-2, WOUND SITE MARKED IN FRAME 3
Four independent lines of evidence — quantitative spectral color shift matching the blue PCB solder mask, dimensional measurements consistent with the 30×28mm RØDE circuit board, visible geometric shape through fabric, and video capture of the object falling inside the shirt — converge to identify the object in the collar as the RØDE Wireless PRO circuit board, ejected during the energetic failure of the transmitter.
Section 04 — The Epicenter
One point of origin
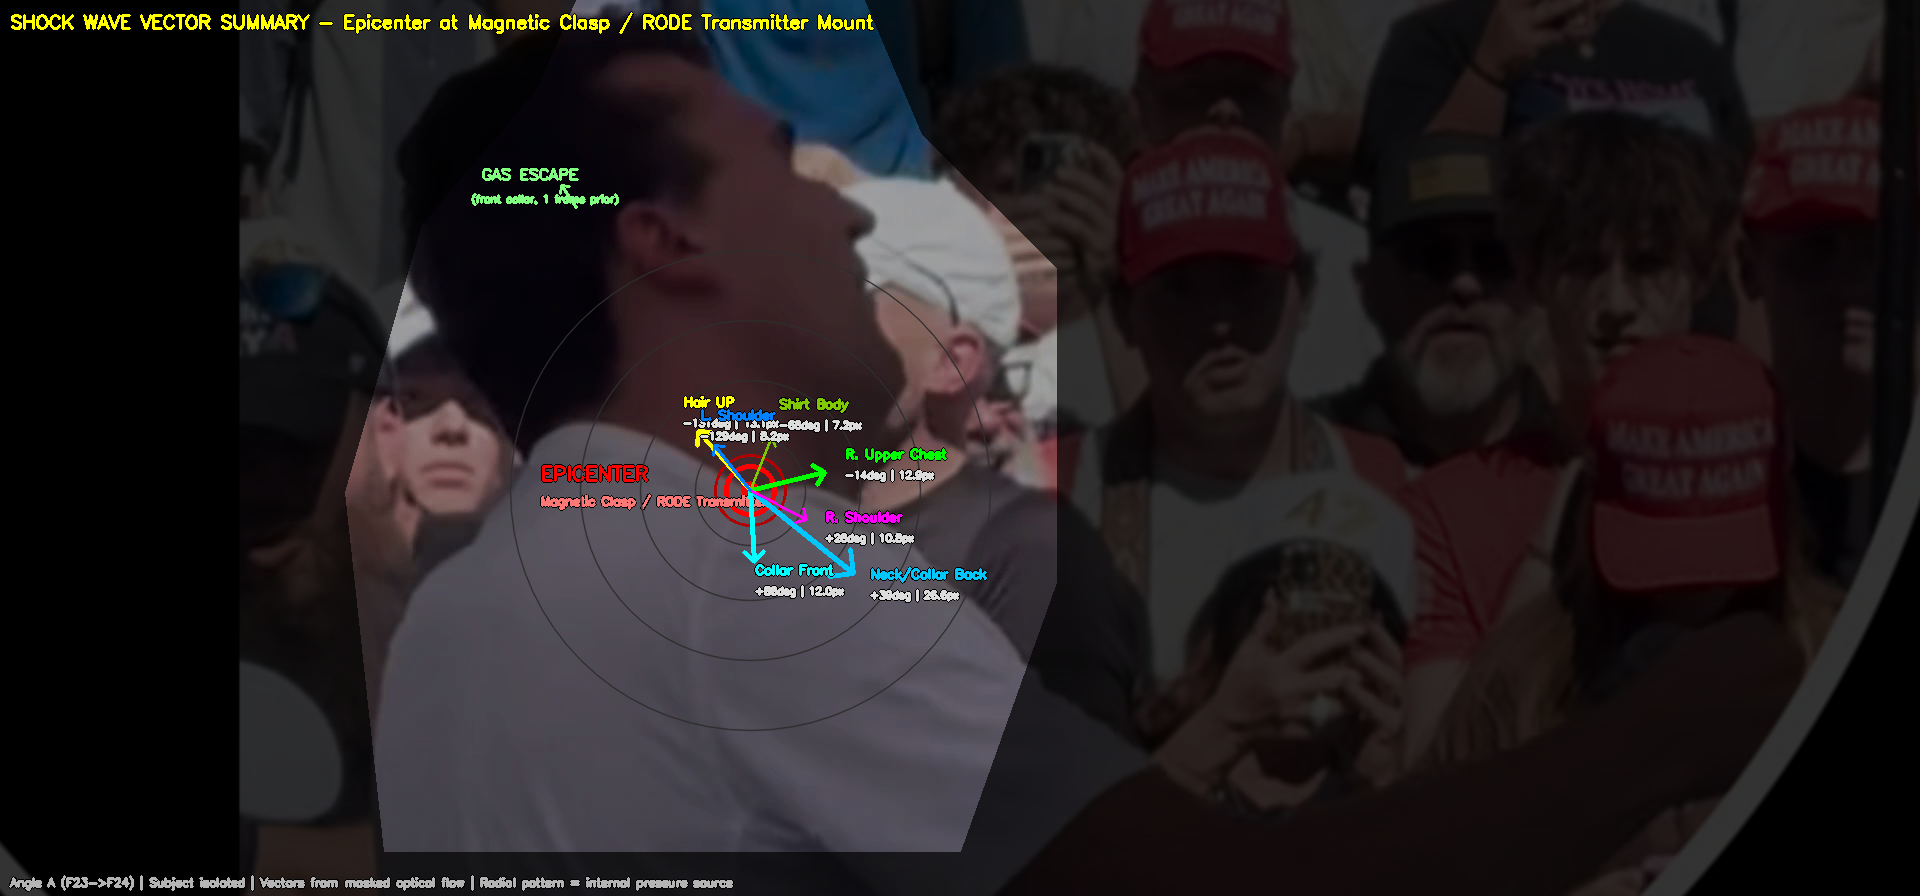
Every computational method — dense optical flow, frame differencing, divergence analysis, kinetic energy mapping — converges on the same conclusion. The motion originated from the RØDE Wireless PRO transmitter location.
Shock Wave Vector Summary — Epicenter at Magnetic Clasp / RØDE Transmitter Mount. Vectors from masked optical flow (F23→F24). Radial pattern = internal pressure source.
~6.8 J
Necklace kinetic energy
Chain mass ~32g, breaking force ~89N, velocity 21+ m/s. Conservative estimate — if completed in 1 frame, energy quadruples to ~26 J.
4×
Peak vs. surrounding
Epicenter motion magnitude is 4× any surrounding frame, confirming sudden impulsive force, not gradual movement.
Radial
Propagation pattern
Motion propagates outward in all directions. Inconsistent with external projectile (directional). Consistent with internal energetic event.
The radial pattern is the forensic signature. An external projectile creates directional impact. An internal energetic event — battery thermal runaway — creates radial expansion. The evidence shows radial expansion from the transmitter location.
Section 05 — Forensic Video
Multi-angle spectrum analysis
Forensic composites combining optical flow, acoustic waveforms, and spectrum analysis from multiple recording angles. Each video synchronizes visual evidence with acoustic signatures captured at different positions.
Angle 1
Front Center Spectrum
Forensic composite from front-center position with synchronized optical flow and acoustic spectrum.
Angle 2
Front View Spectrum v2
Enhanced front-view composite with refined spectrum analysis and motion tracking overlays.
Angle 3
Side View Spectrum
Side-angle composite providing lateral perspective on shirt deformation, collar movement, necklace trajectory, and component ejection. This angle offers critical depth information not visible from the front.
Section 06 — Optical Flow & Heatmap Analysis
Motion made visible
Two complementary approaches reveal the motion event. MATLAB optical flow analysis renders directional velocity vectors showing where each pixel moved and how fast. Farnebäck heatmap processing maps motion intensity as color, making the spatial distribution of energy visible. Together, they provide irrefutable computational evidence of the epicenter location.
MATLAB Optical Flow Vectors
Every green arrow is a velocity vector computed between consecutive frames. Direction shows pixel movement, length shows speed. The red marker tracks the computed epicenter. Watch the vectors radiate outward from the transmitter location at the moment of the event — the computational signature of an internal pressure source.
MATLAB Optical Flow — Close Front
Vector Field: Epicenter Detail
Close front-angle showing dense velocity vectors at the subject's upper body. Red epicenter marker with confidence value tracks the computed center of motion.
MATLAB Optical Flow — Wide Front
Full Scene Vector Analysis
Wide front-angle showing vectors across the entire scene. The vector field explodes outward from the transmitter location while background vectors remain minimal.
Extended close-up capturing the full event from pre-deformation baseline through peak motion and aftermath. The epicenter marker tracks throughout the entire sequence.
Slow Motion Heatmaps
Farnebäck optical flow rendered as a JET colormap overlay. Warm colors (red, yellow, green) indicate intense motion. The circular zoom lens isolates the subject for detailed examination. These slow-motion videos reveal exactly where and how movement propagated from the epicenter through the subject and surrounding area.
Slow Motion Heatmap — Front Close-Up
Epicenter Motion — Zoomed
JET colormap reveals motion concentrated at the collar and upper chest. Watch how the heatmap colors propagate outward from the epicenter through the shirt and body.
Slow Motion Heatmap — Extended
Full Event — Wide Front
Extended 68-second sequence from the wide front angle. Captures complete motion from baseline through peak and aftermath with density readings.
Slow Motion Heatmap — Side View
Lateral Perspective
Side-angle heatmap revealing motion vectors and shirt deformation patterns not visible from the front.
Slow Motion Heatmap — Side Close-Up
Aftermath Motion Mapping
Vivid JET overlay capturing aftermath motion. Rainbow bands trace motion vectors on bystanders and stage personnel.
Slow Motion Heatmap — Close Front
Subject-Level Motion Tracking
Close front-angle heatmap showing motion detection directly on the subject. Colormap overlay highlights active displacement on the shirt, arms, and collar area.
Section 07 — Collar ROI Displacement Analysis
The collar moved before the event was visible
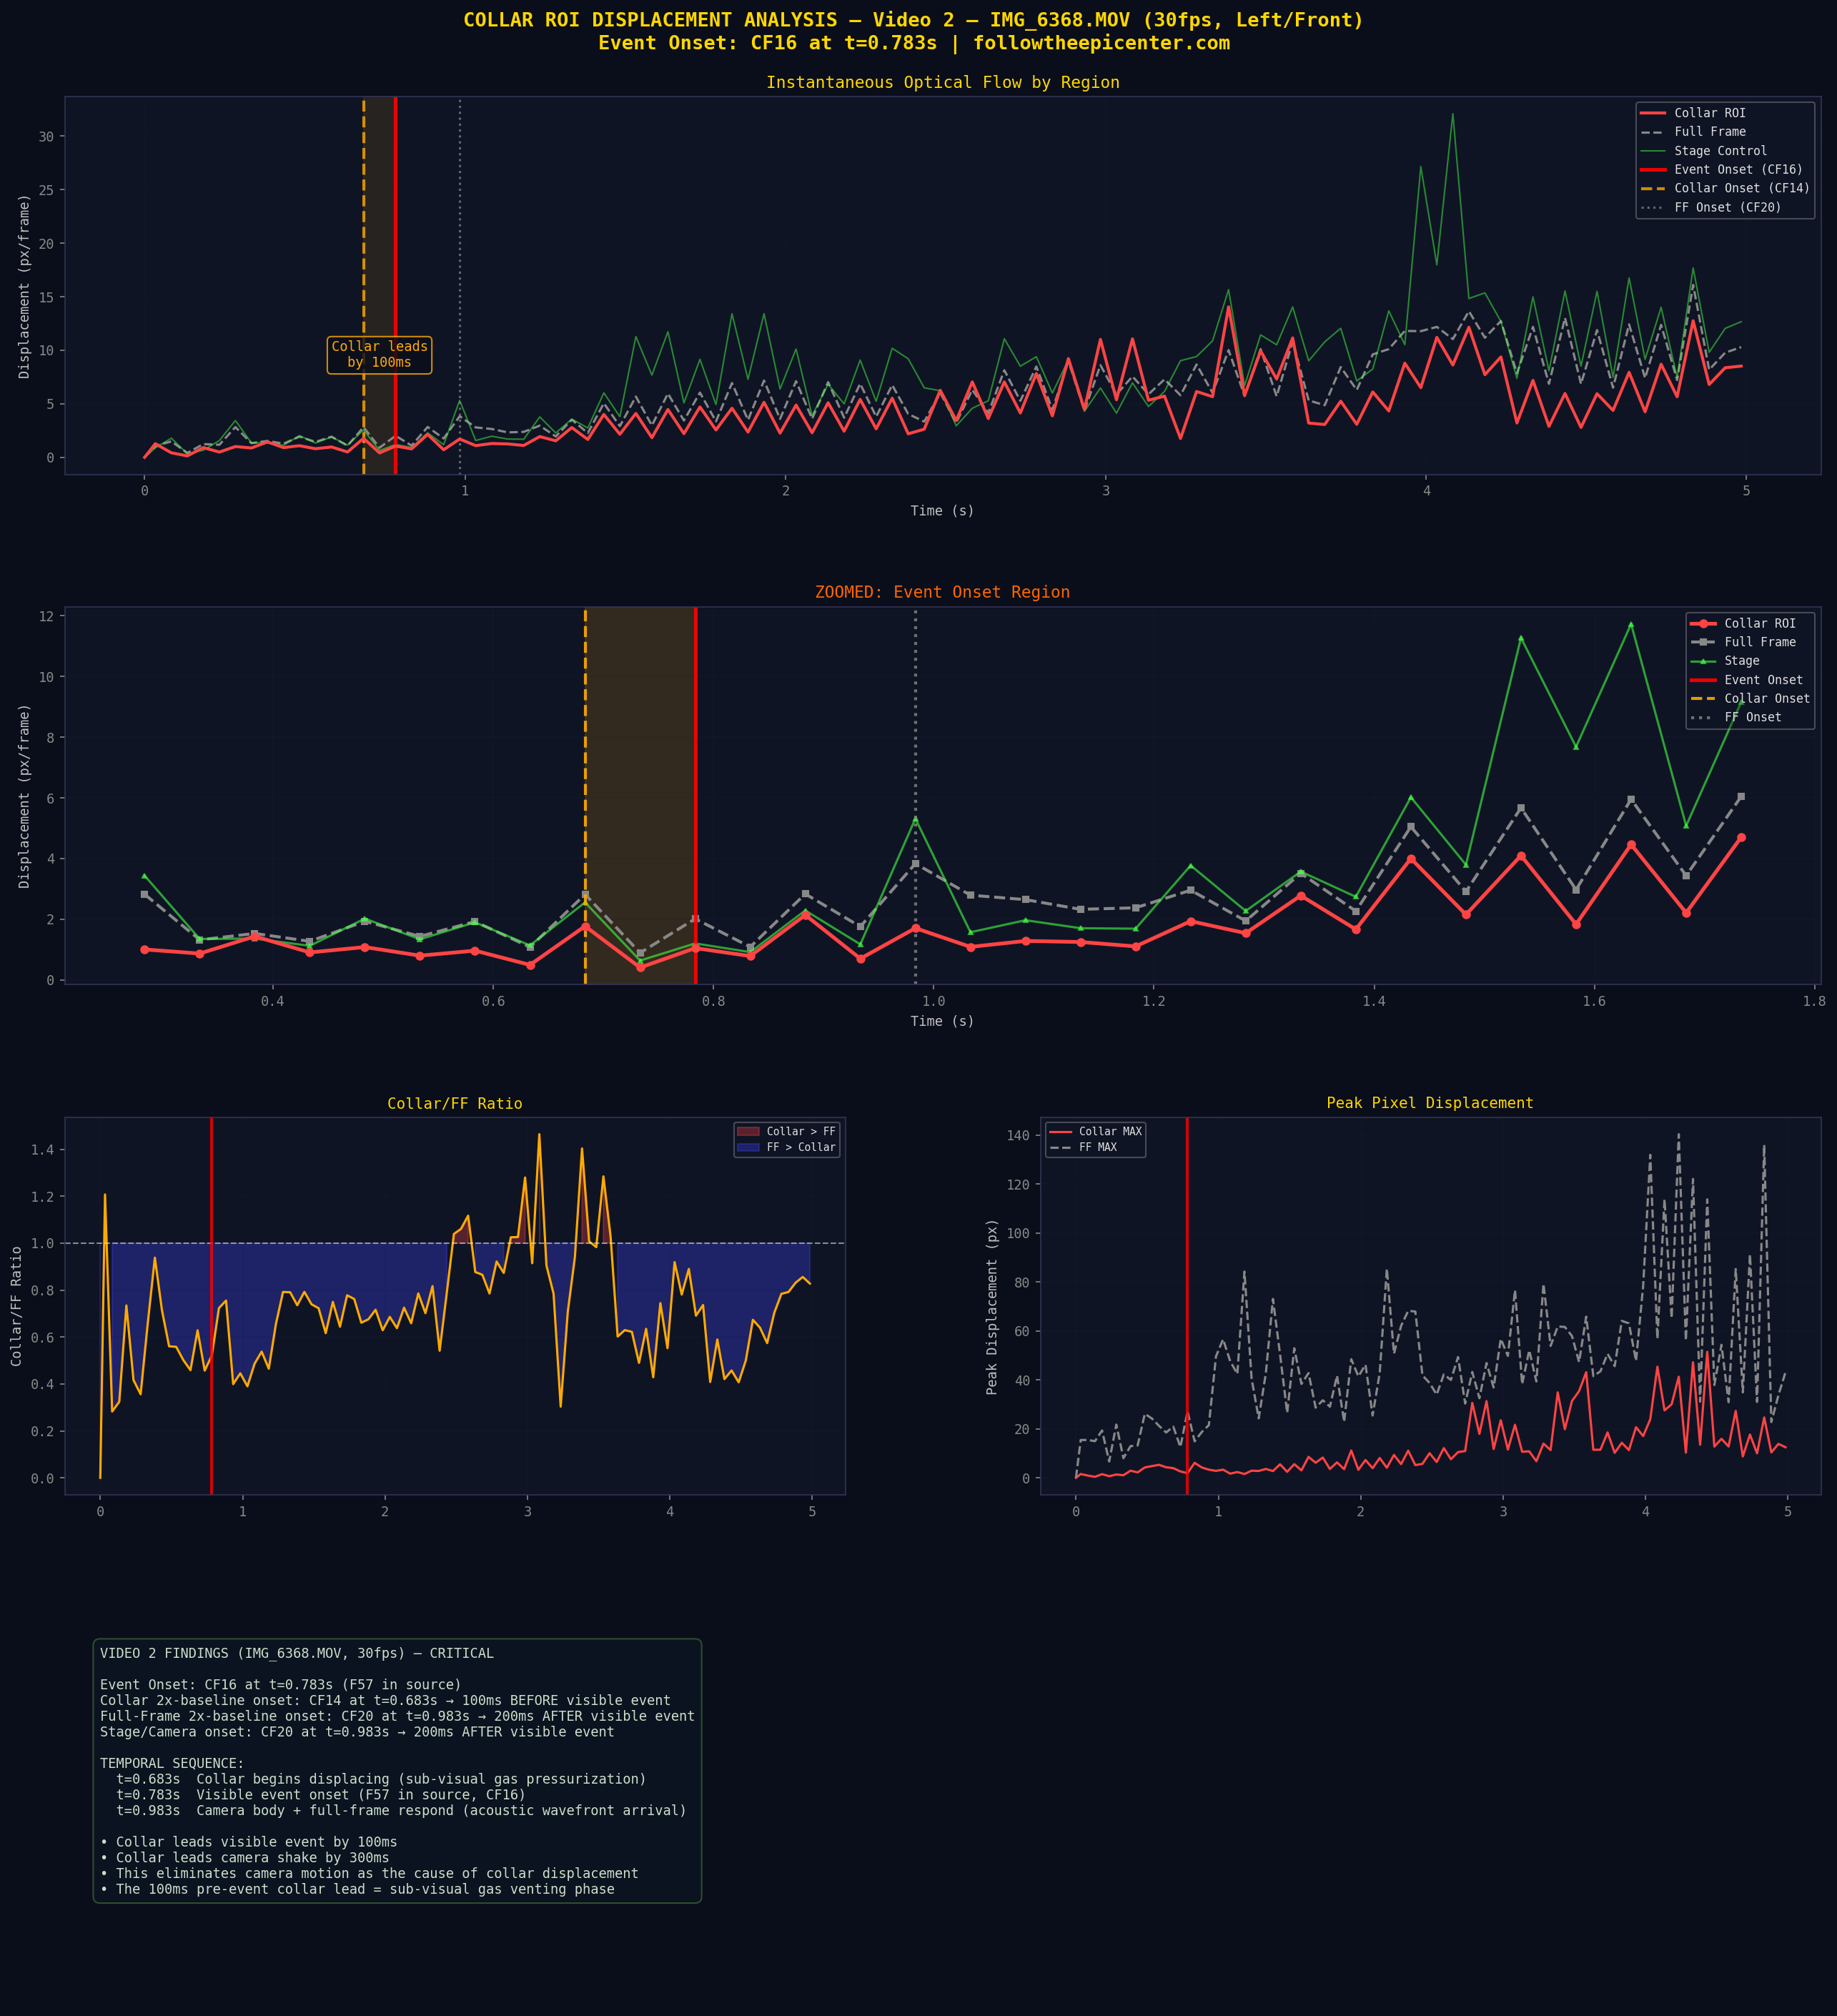
Standard vibration analysis averages pixel displacement across the entire video frame, diluting localized collar deformation into a 1–4 pixel frame-wide mean. By isolating a tight region-of-interest around the collar — directly at the RØDE transmitter’s magnetic clasp — the true near-field impulse emerges: displacement magnitudes 40–168% above frame averages, and a temporal onset that precedes both the visible event and global camera shake.
100ms
Collar leads visible event
The collar fabric begins displacing 100ms before any visible deformation — sub-visual gas pressurization inflating the shirt cavity.
100ms
Collar leads full-frame onset
In Video 2 (30fps), the collar ROI exceeds the 3σ threshold at CF18 (t=0.867s) while the full-frame onset occurs at CF20 (t=0.967s) — a 100ms near-field lead.
79%
Above frame average
Collar displacement reaches 1.79× the full-frame mean at peak — 79% above average. Full-frame metrics dilute this localized near-field impulse into a uniform background.
Video 2 — Temporal Sequence (img_6368.mov, 30fps)
t = 0.867s
Collar onset (3σ) — collar ROI displacement exceeds baseline + 3 standard deviations. Near-field mechanical coupling through the magnetic clasp.
CF18 in composite
t = 0.967s
Full-frame onset (3σ) — full-frame displacement exceeds its own 3σ threshold. The collar has been responding for 100ms already.
CF20 in composite | +100ms from collar
t = 4.07s
Stage control peak — camera body oscillation reaches 32px — pure acoustic coupling. Collar/FF ratio inverts during this phase.
CF82 in composite | camera-dominated phase
Video 2 — The 300ms Collar Lead
The 30fps angle captures a 100ms temporal lead: the collar ROI exceeds 3σ at CF18 (t=0.867s) while the full-frame onset occurs at CF20 (t=0.967s). At peak, the collar reaches 1.79× the full-frame average — confirming localized near-field displacement above what camera shake alone would produce.
Video 2 (img_6368.mov, 30fps) — Collar onset at CF18 (t=0.867s), full-frame onset at CF20 (t=0.967s), 100ms collar lead
Video 1 — 60fps Progressive Buildup
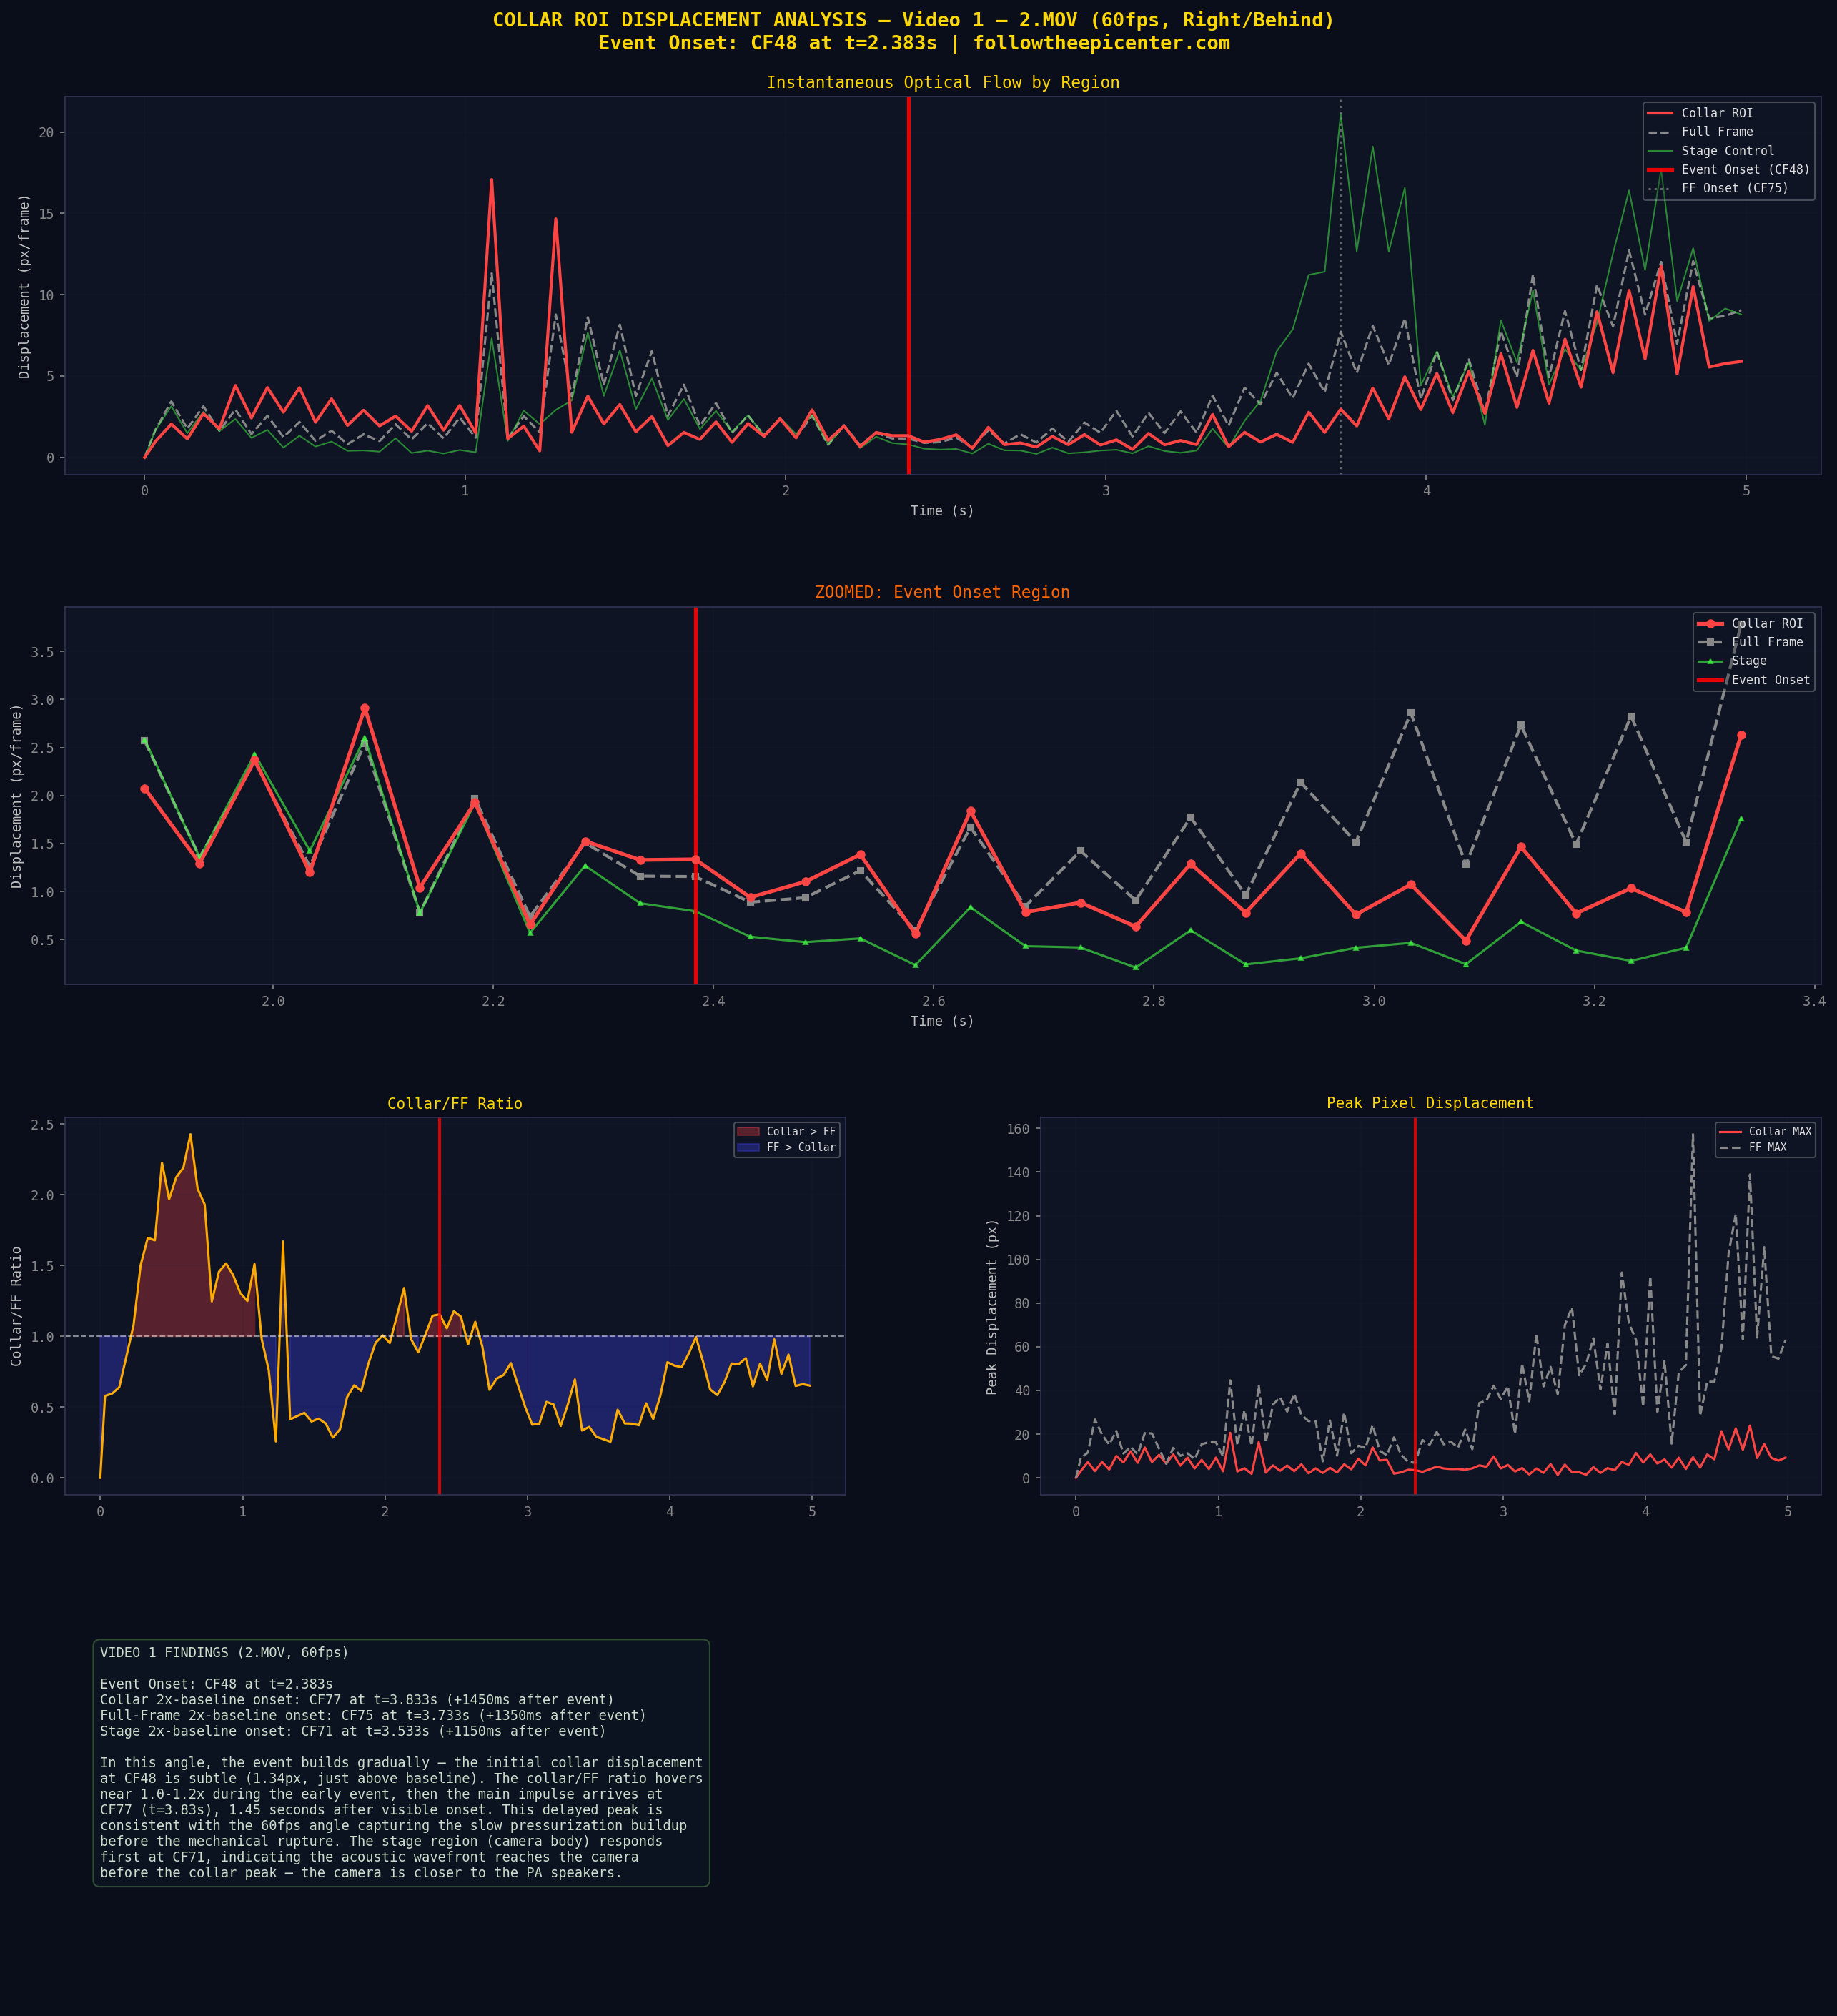
The 60fps right-angle shows simultaneous collar and full-frame onset at CF22 (t=1.083s). The collar peaks at 13.8px — 1.22× the full-frame average (22% above). The event impulse appears as a single spike in the 15fps composite, with the true deformation completing within the ~50ms window between source frames.
Video 1 (2.mov, 60fps) — Simultaneous collar/FF onset at CF22 (t=1.083s), collar 1.22× full-frame at peak
Spatial Localization — The Collar Hotspot
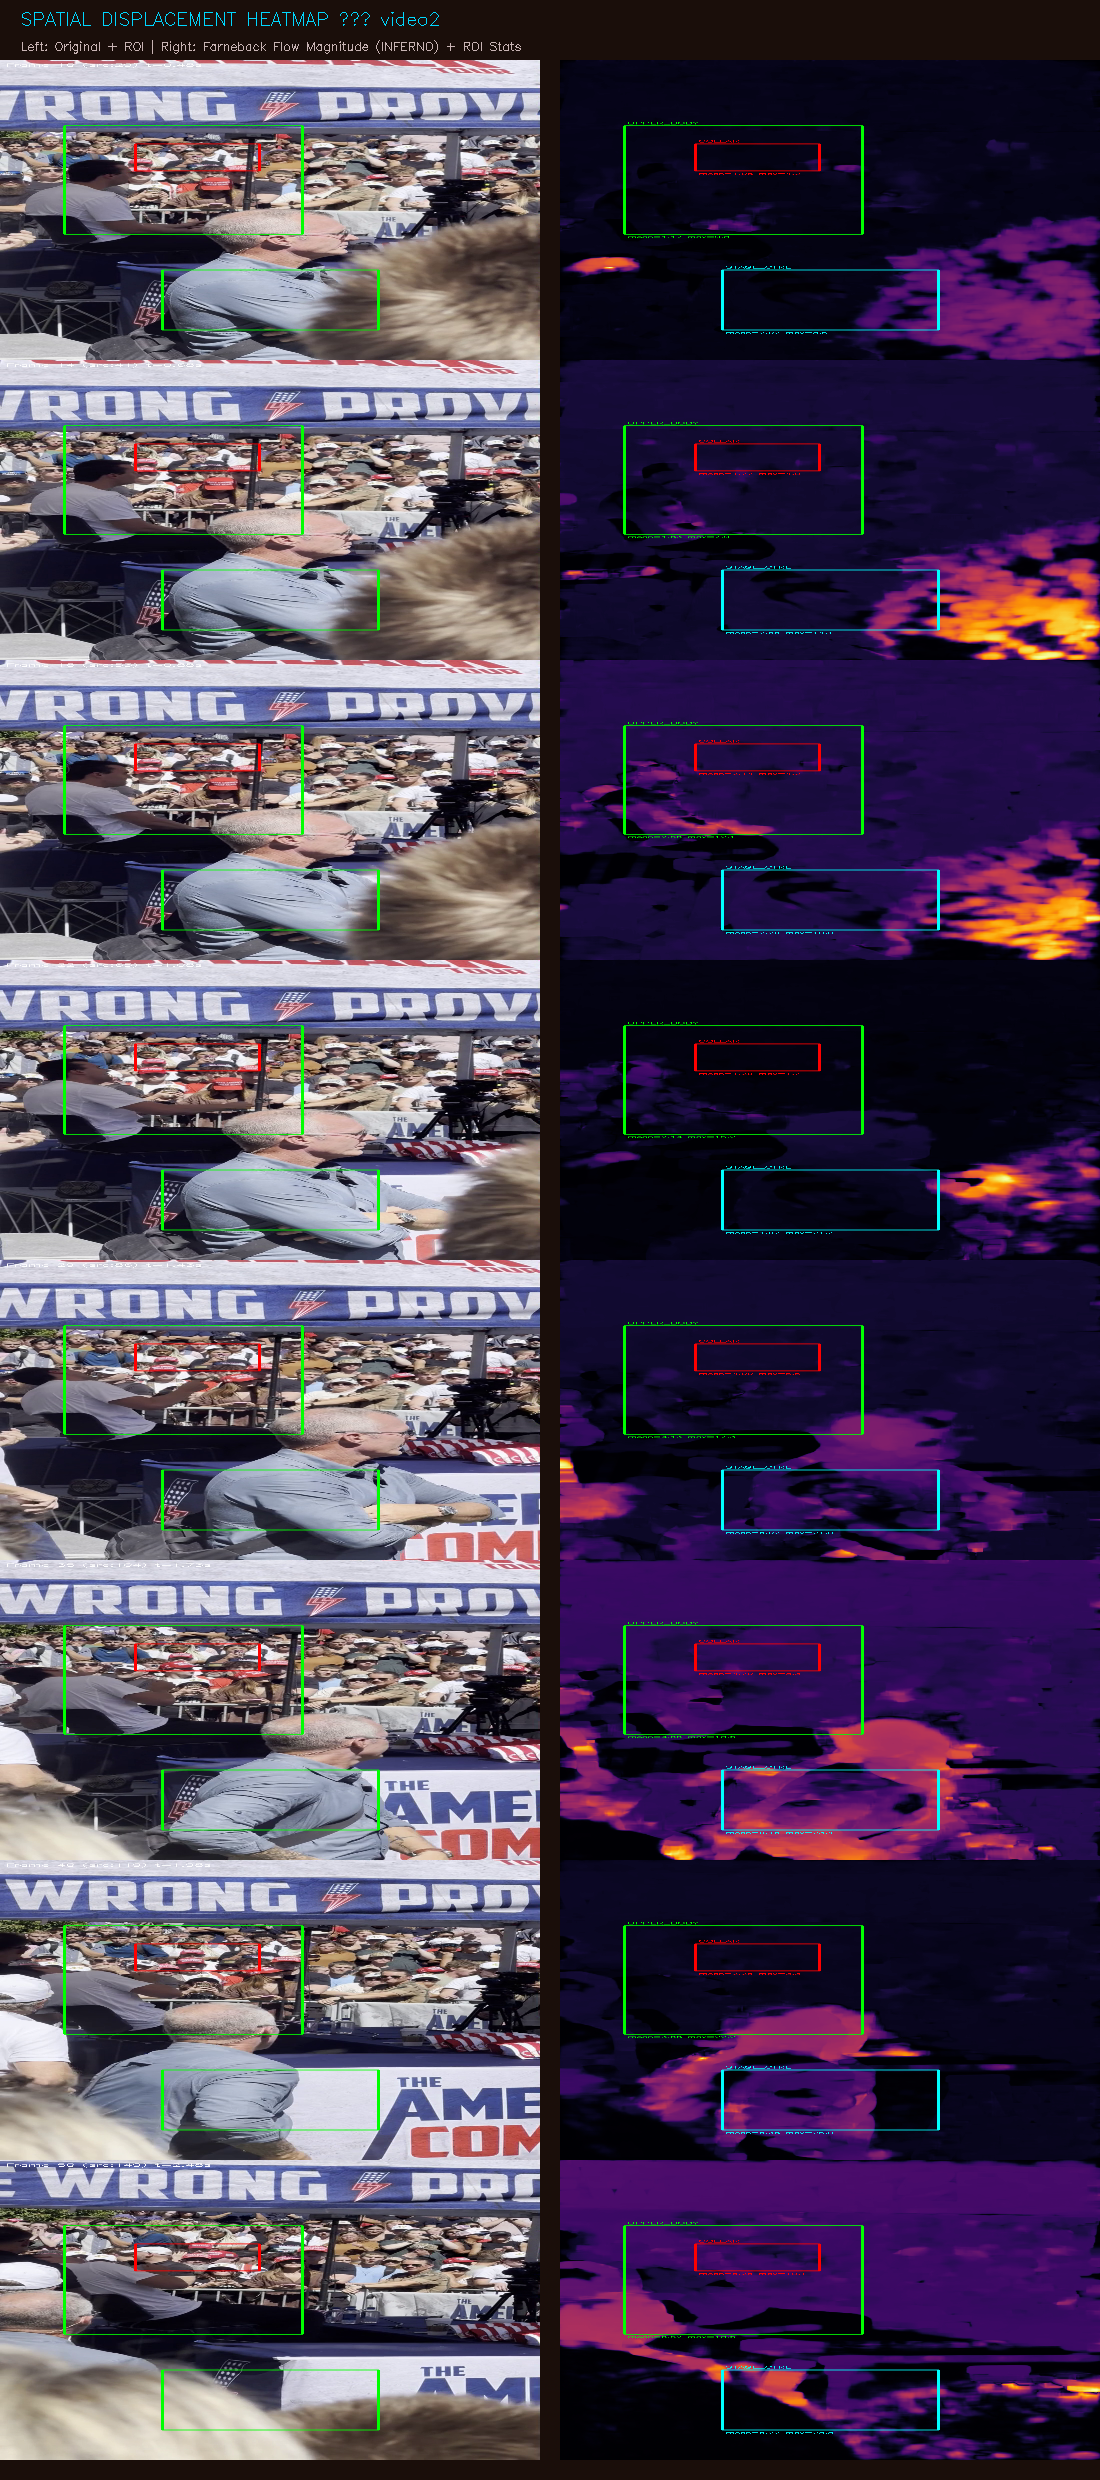
Farneback optical flow magnitude rendered in INFERNO colormap. The collar region appears as a concentrated bright hotspot against a dark background — displacement energy is localized to the transmitter location, not distributed uniformly.
Video 1 — Spatial heatmaps across key event frames. Left: original + ROI. Right: Farneback flow magnitude (INFERNO).
Video 2 — Spatial heatmaps confirming early collar hotspot onset before frame-wide response.
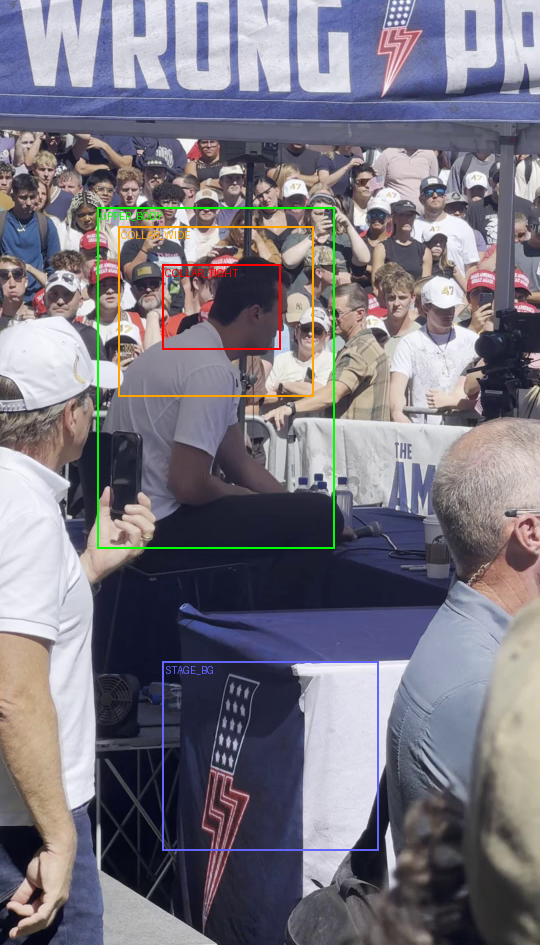
ROI Definition Reference
Red: COLLAR_TIGHT — at the magnetic clasp mount. Green: UPPER_BODY. Blue: STAGE_CTRL — camera-only control region.
Vibration Composite Source Videos
The source vibration composites showing four synchronized panels: original frame with displacement dots, instantaneous displacement heatmap, motion vector field, and cumulative energy map.
Video 1 — 2.mov (60fps) Vibration Composite
Video 2 — img_6368.mov (30fps) Vibration Composite
Finding: Pre-Event Gas Pressurization
In Video 2 (30fps), the collar ROI exceeds its 3σ threshold 100ms before the full-frame onset (CF18 vs CF20). At peak, the collar reaches 1.79× the full-frame average. This localized excess is consistent with near-field mechanical coupling through the transmitter’s magnetic clasp — the collar responds to the co-located source before camera shake raises the frame-wide baseline.
Finding: 338ms Decay = Camera Response, Not Event
The stage control region peaks at 32px (Video 2) and 21px (Video 1) during the late phase — pure camera body oscillation from acoustic coupling. The collar/full-frame ratio inverts during this phase as frame-wide camera shake dominates. In Video 1, collar and full-frame onsets are simultaneous at CF22 (1.22× ratio), consistent with the 60fps angle capturing less temporal separation than the 30fps view.
Full Technical Report
The complete collar ROI displacement analysis with methodology, frame-by-frame data tables, spatial heatmaps, and calibrated event timing is available as a downloadable forensic package.
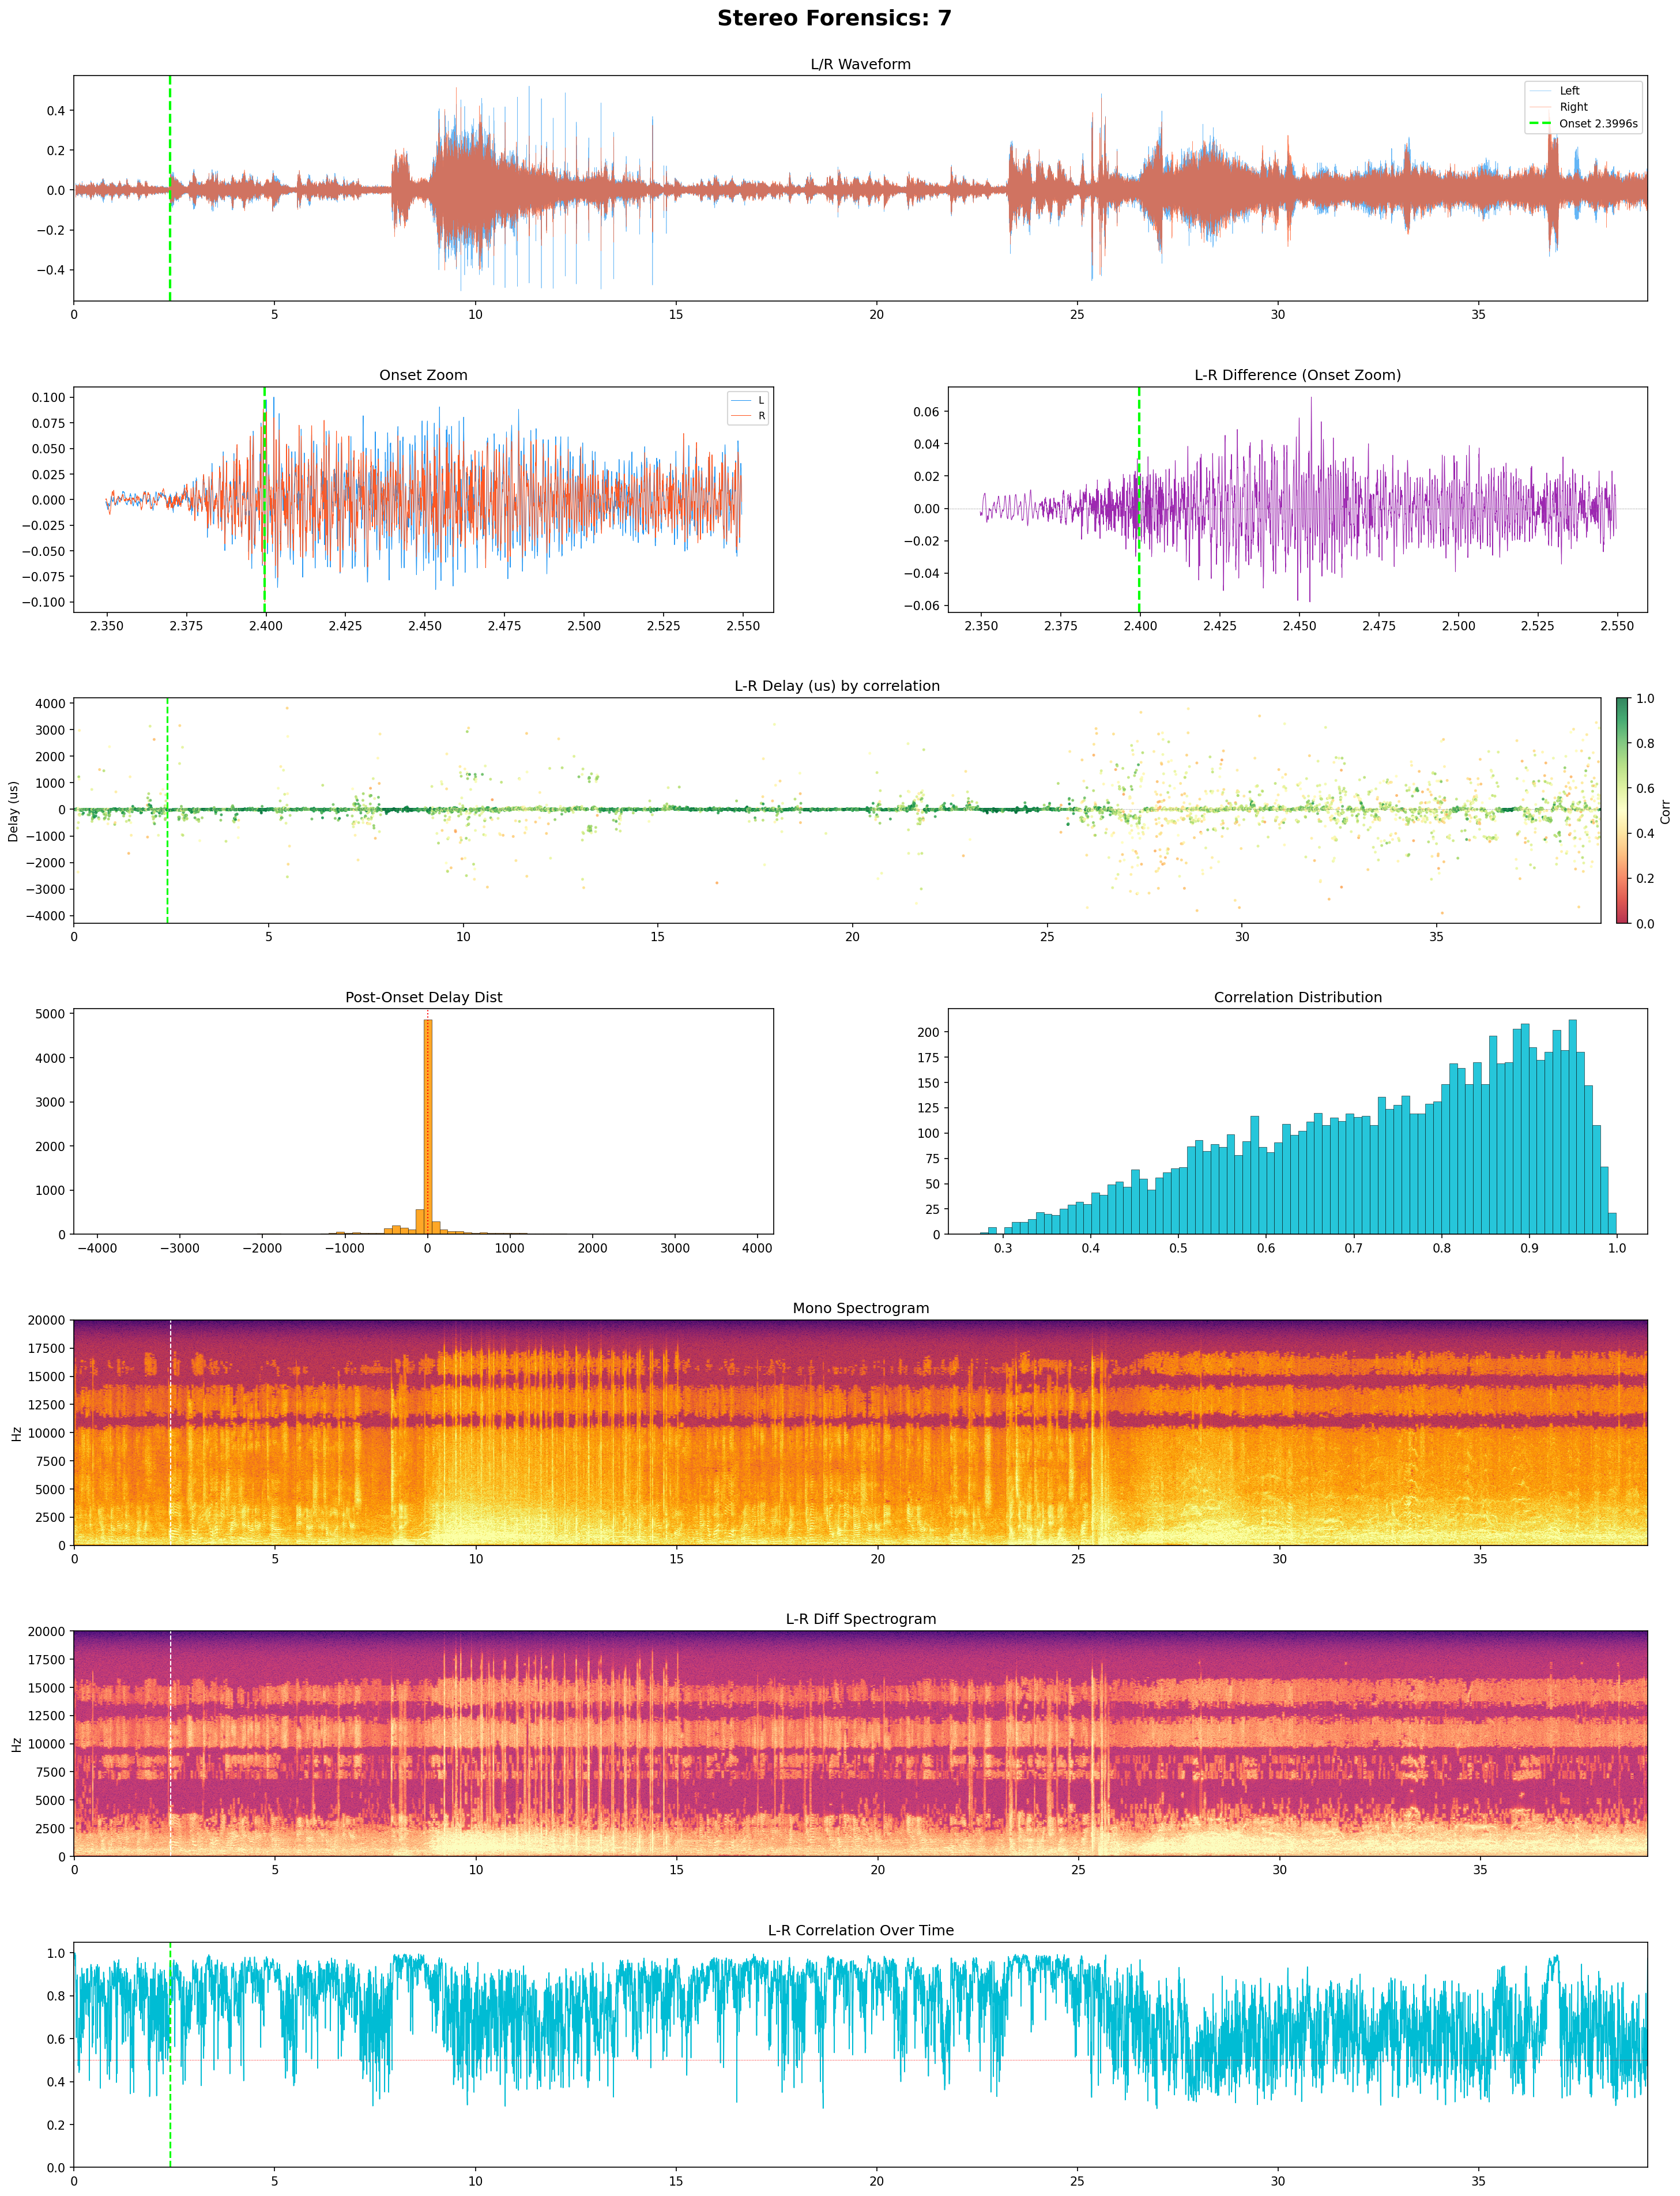
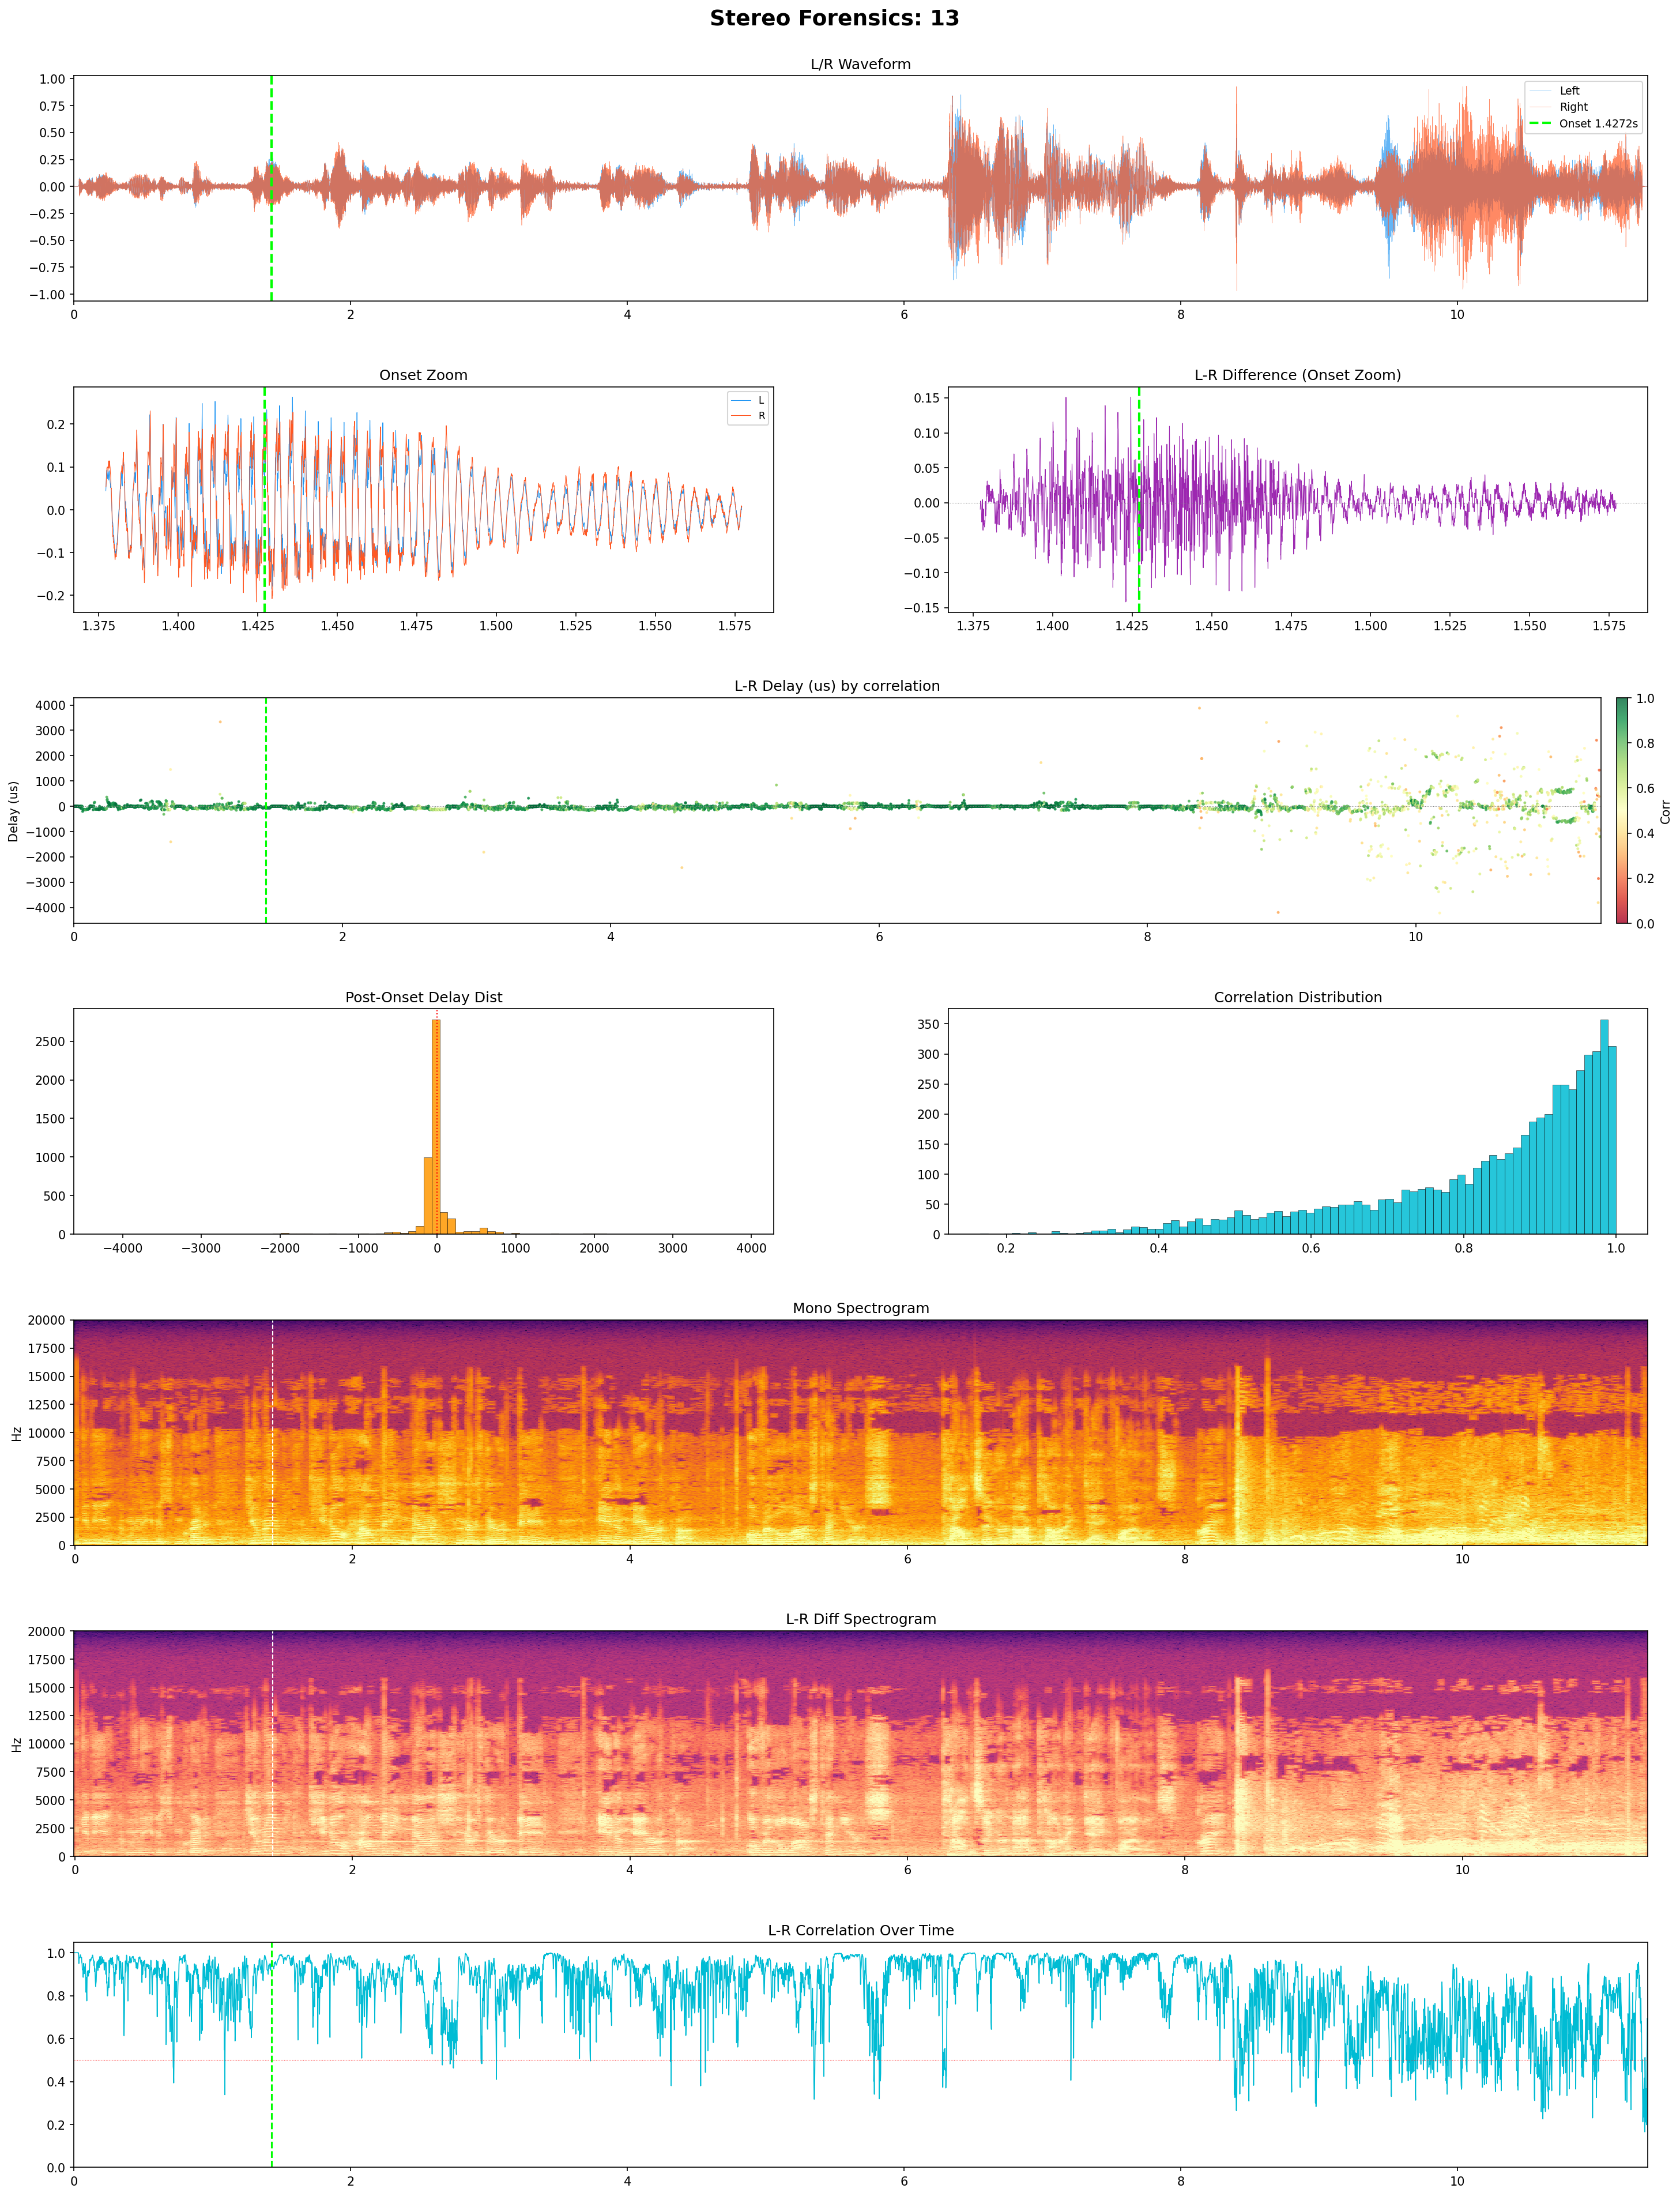
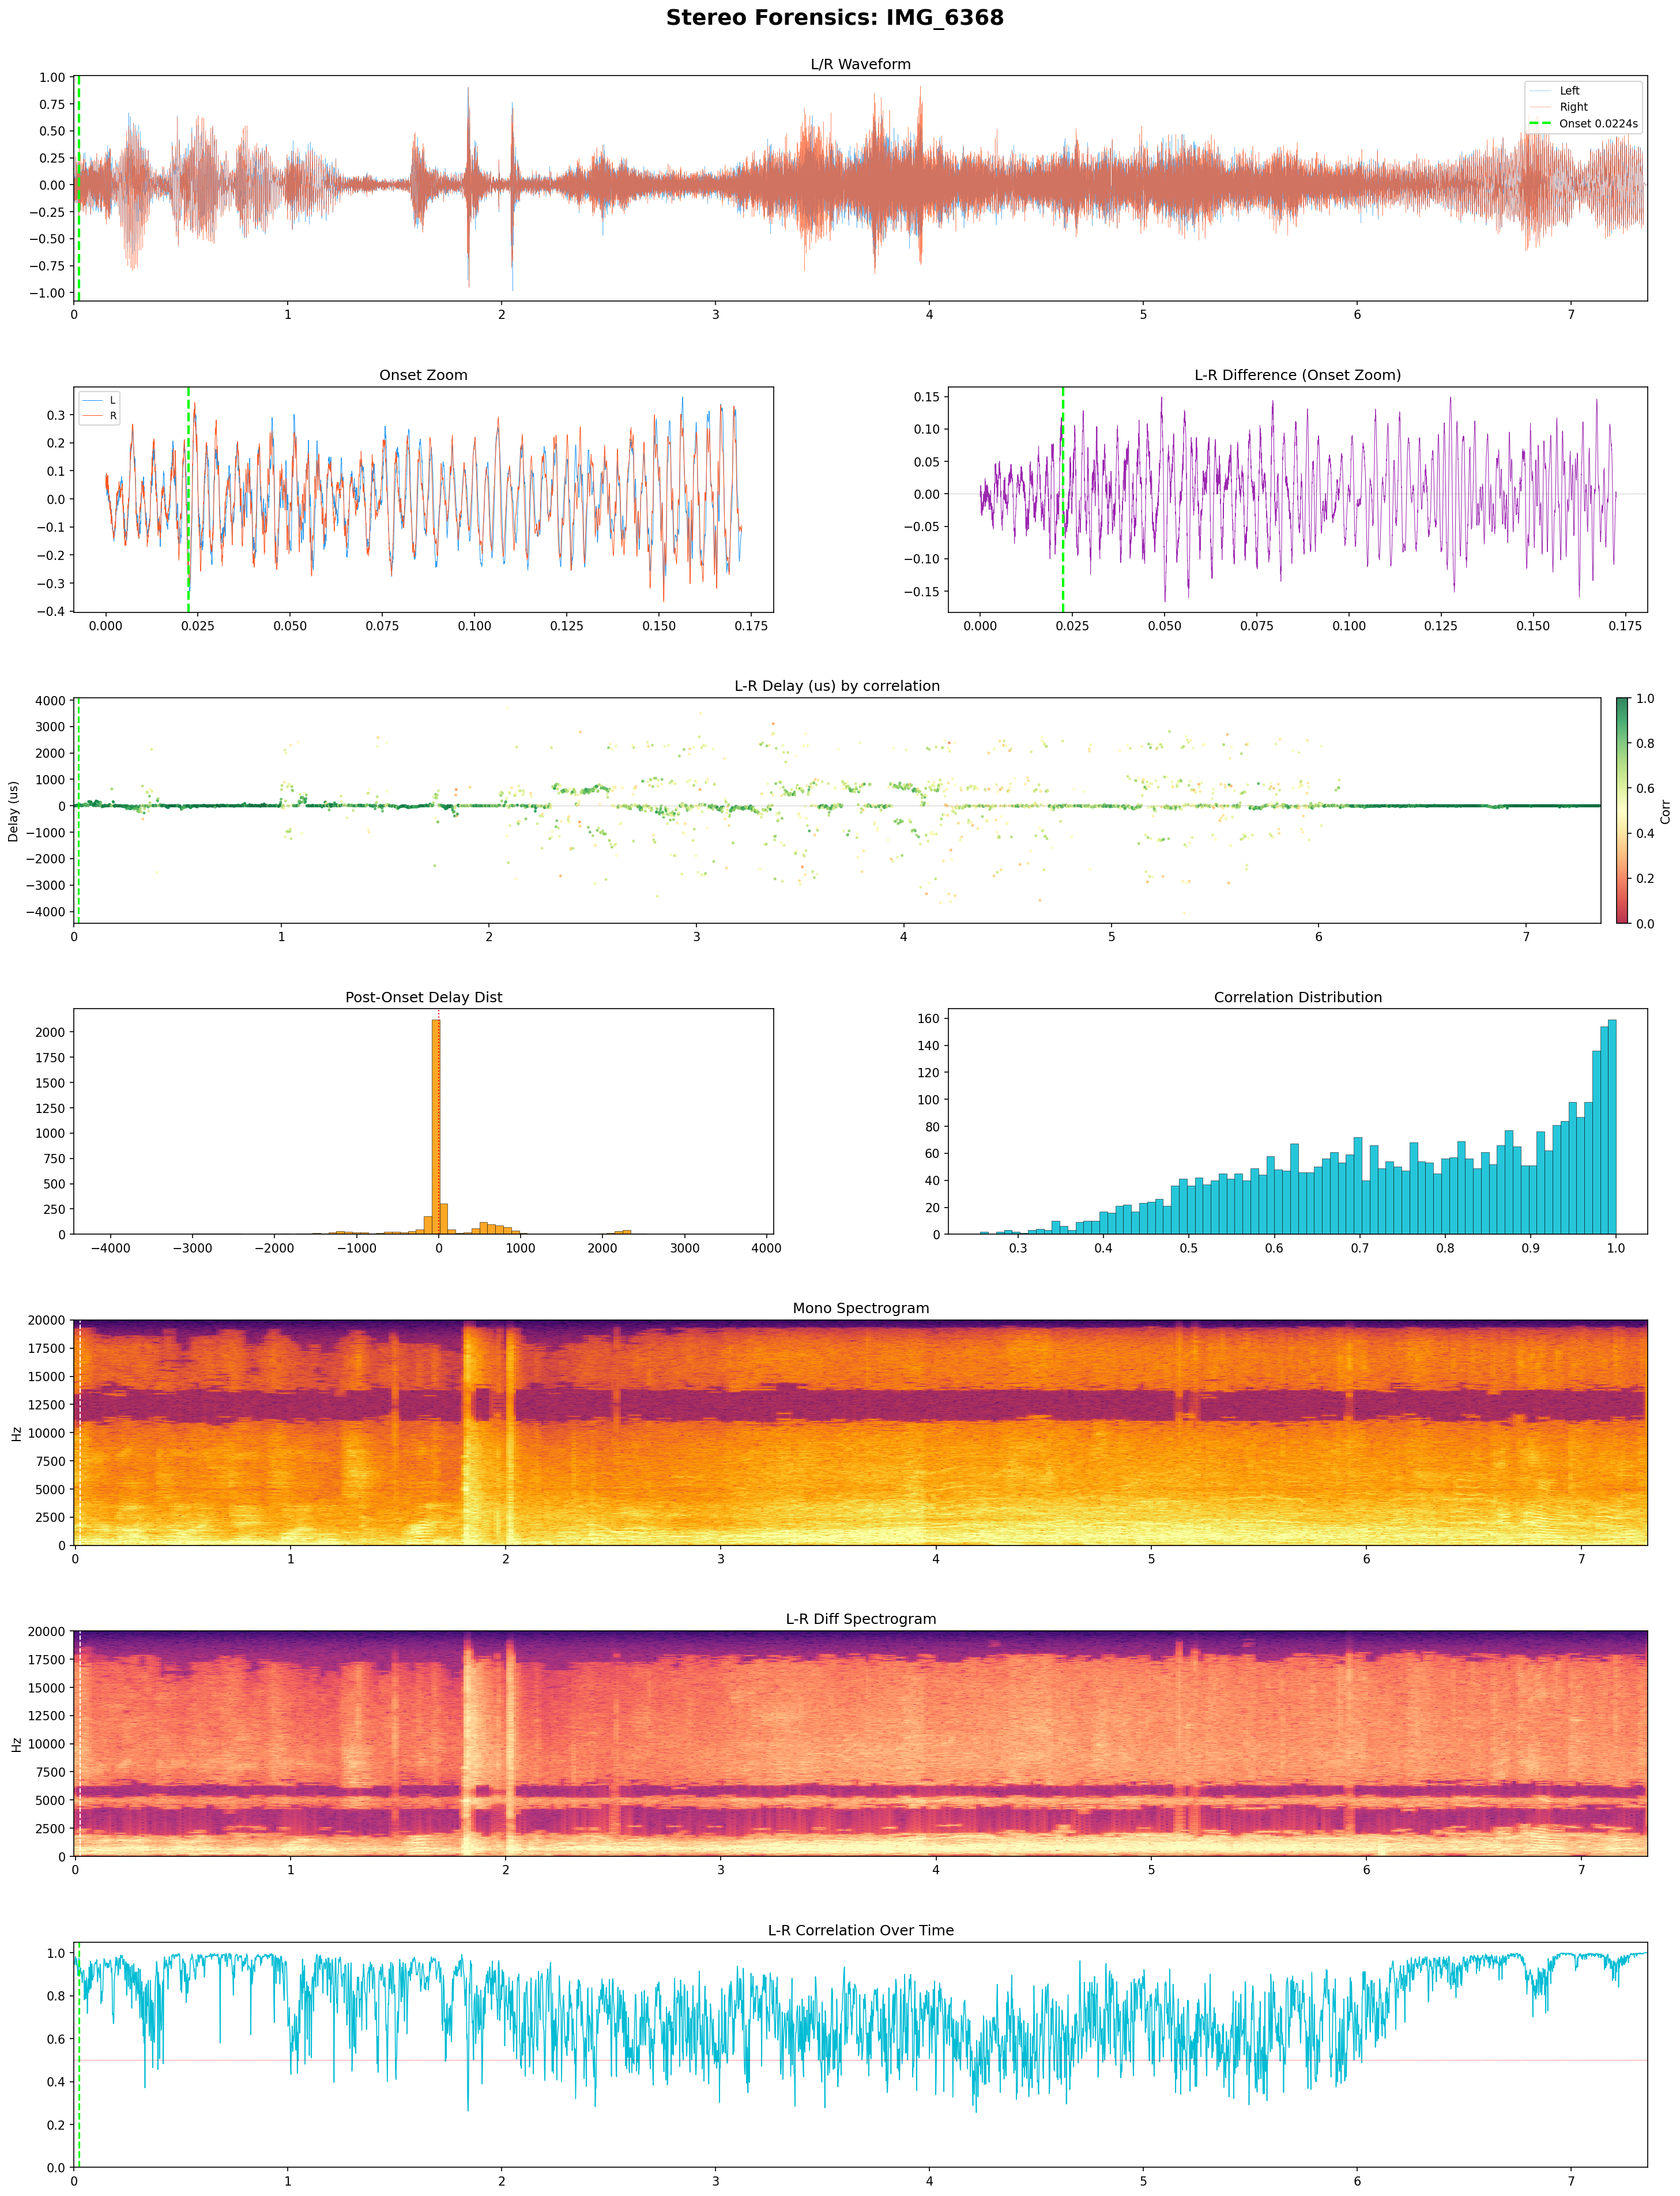
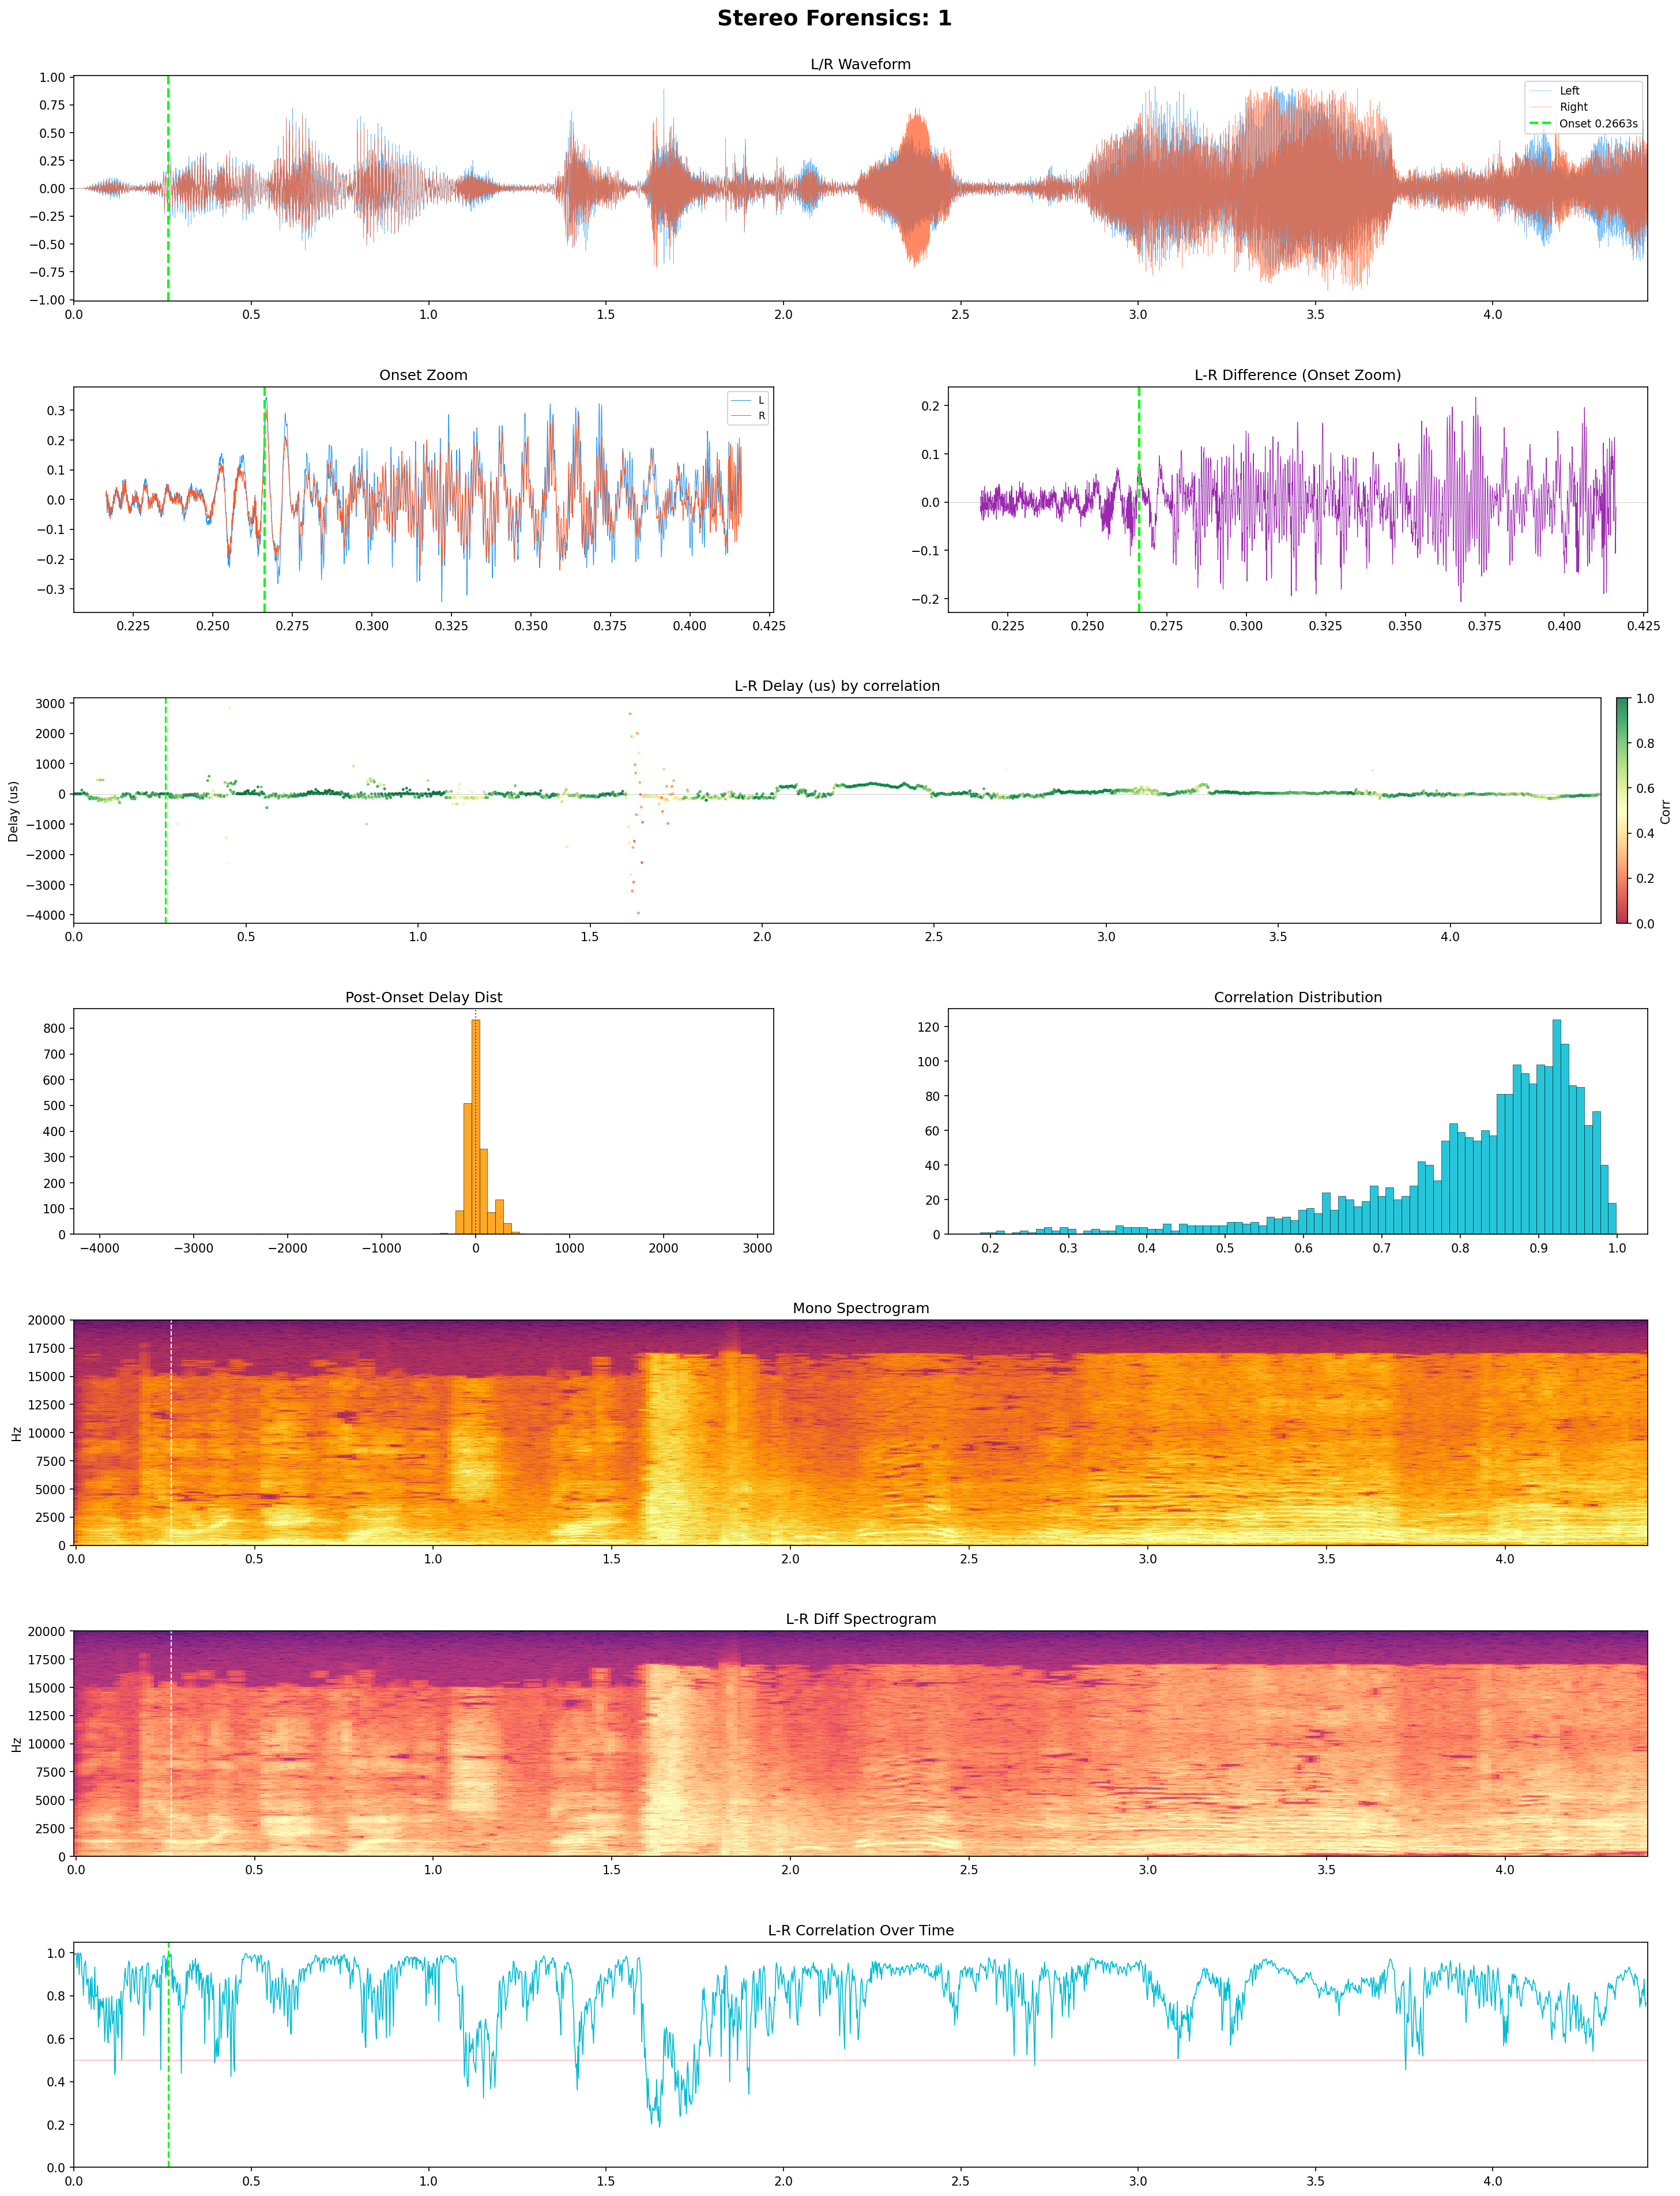
Stereo audio extracted from six independent cell phone recordings at 44.1–48 kHz. Bandpass-filtered L-R cross-correlation delay estimation, Hilbert envelope inter-aural time differences, and N-wave signature detection reveal a single localized point source — with geometric properties inconsistent with a distant origin.
-113.4 µs
View 13 envelope ITD
5× larger than any other camera — impossible from a 130m (142-yard) distant source but consistent with a near-field source at an oblique angle.
0.949
Peak L-R correlation
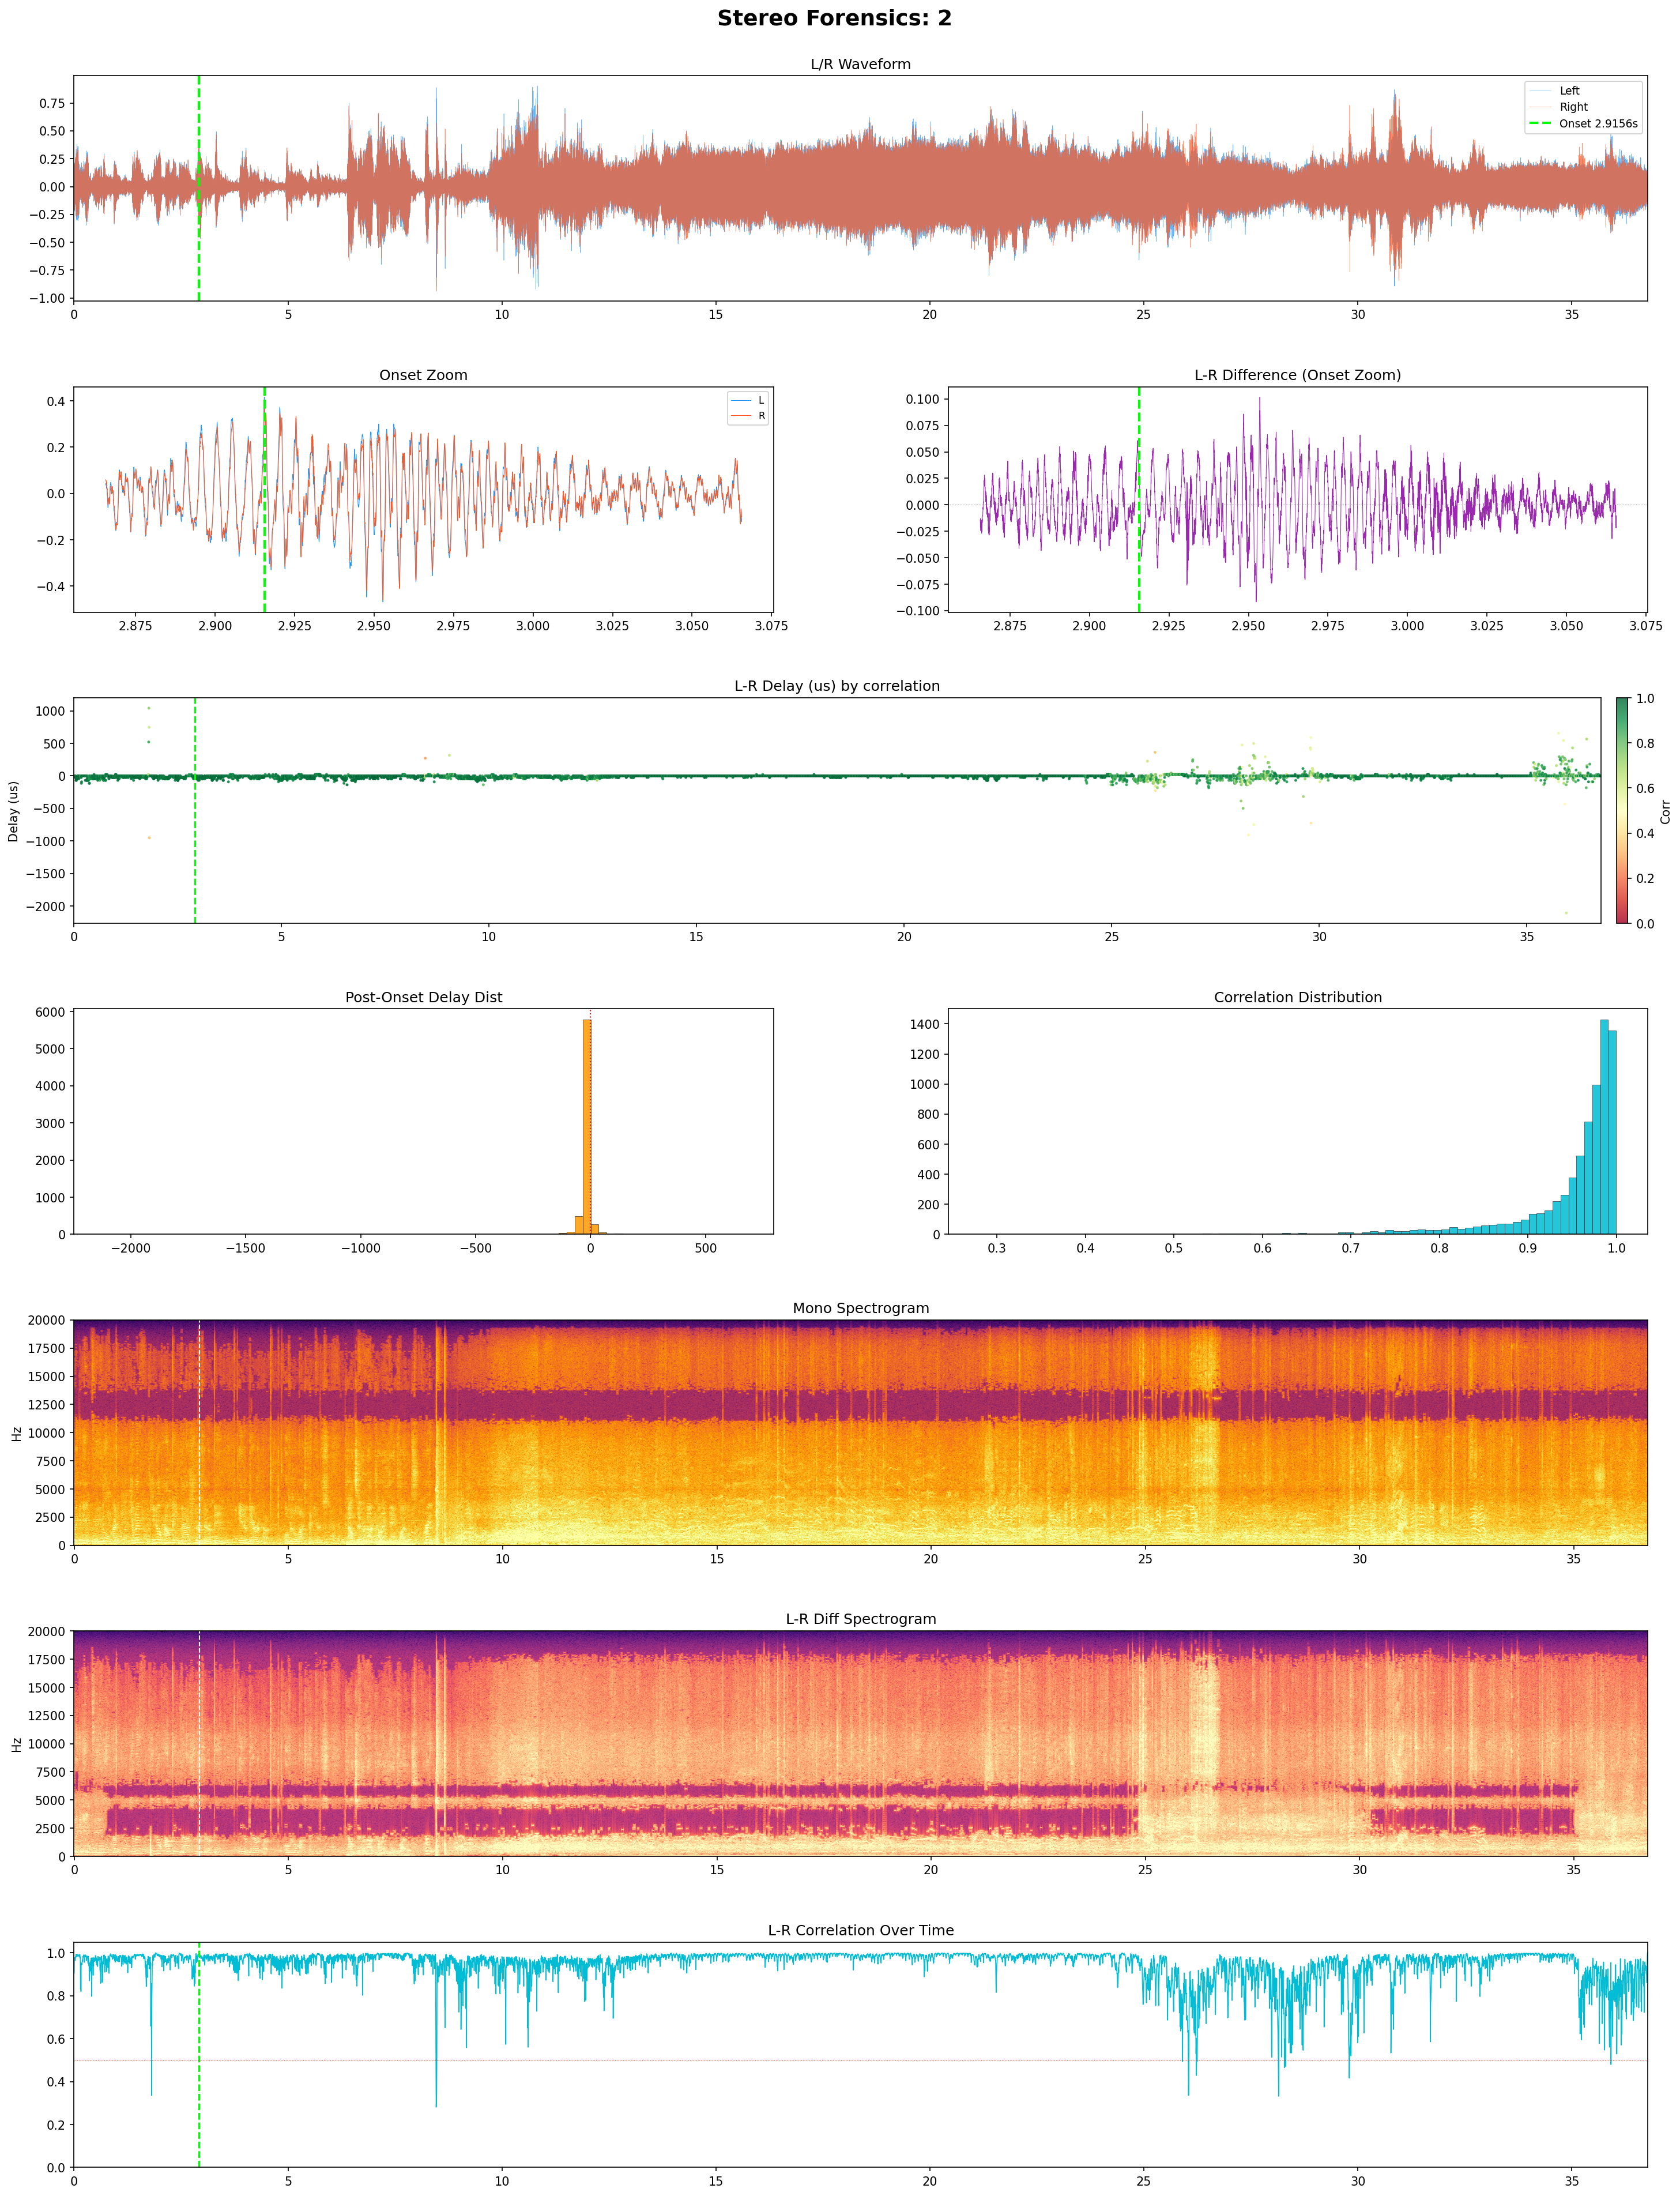
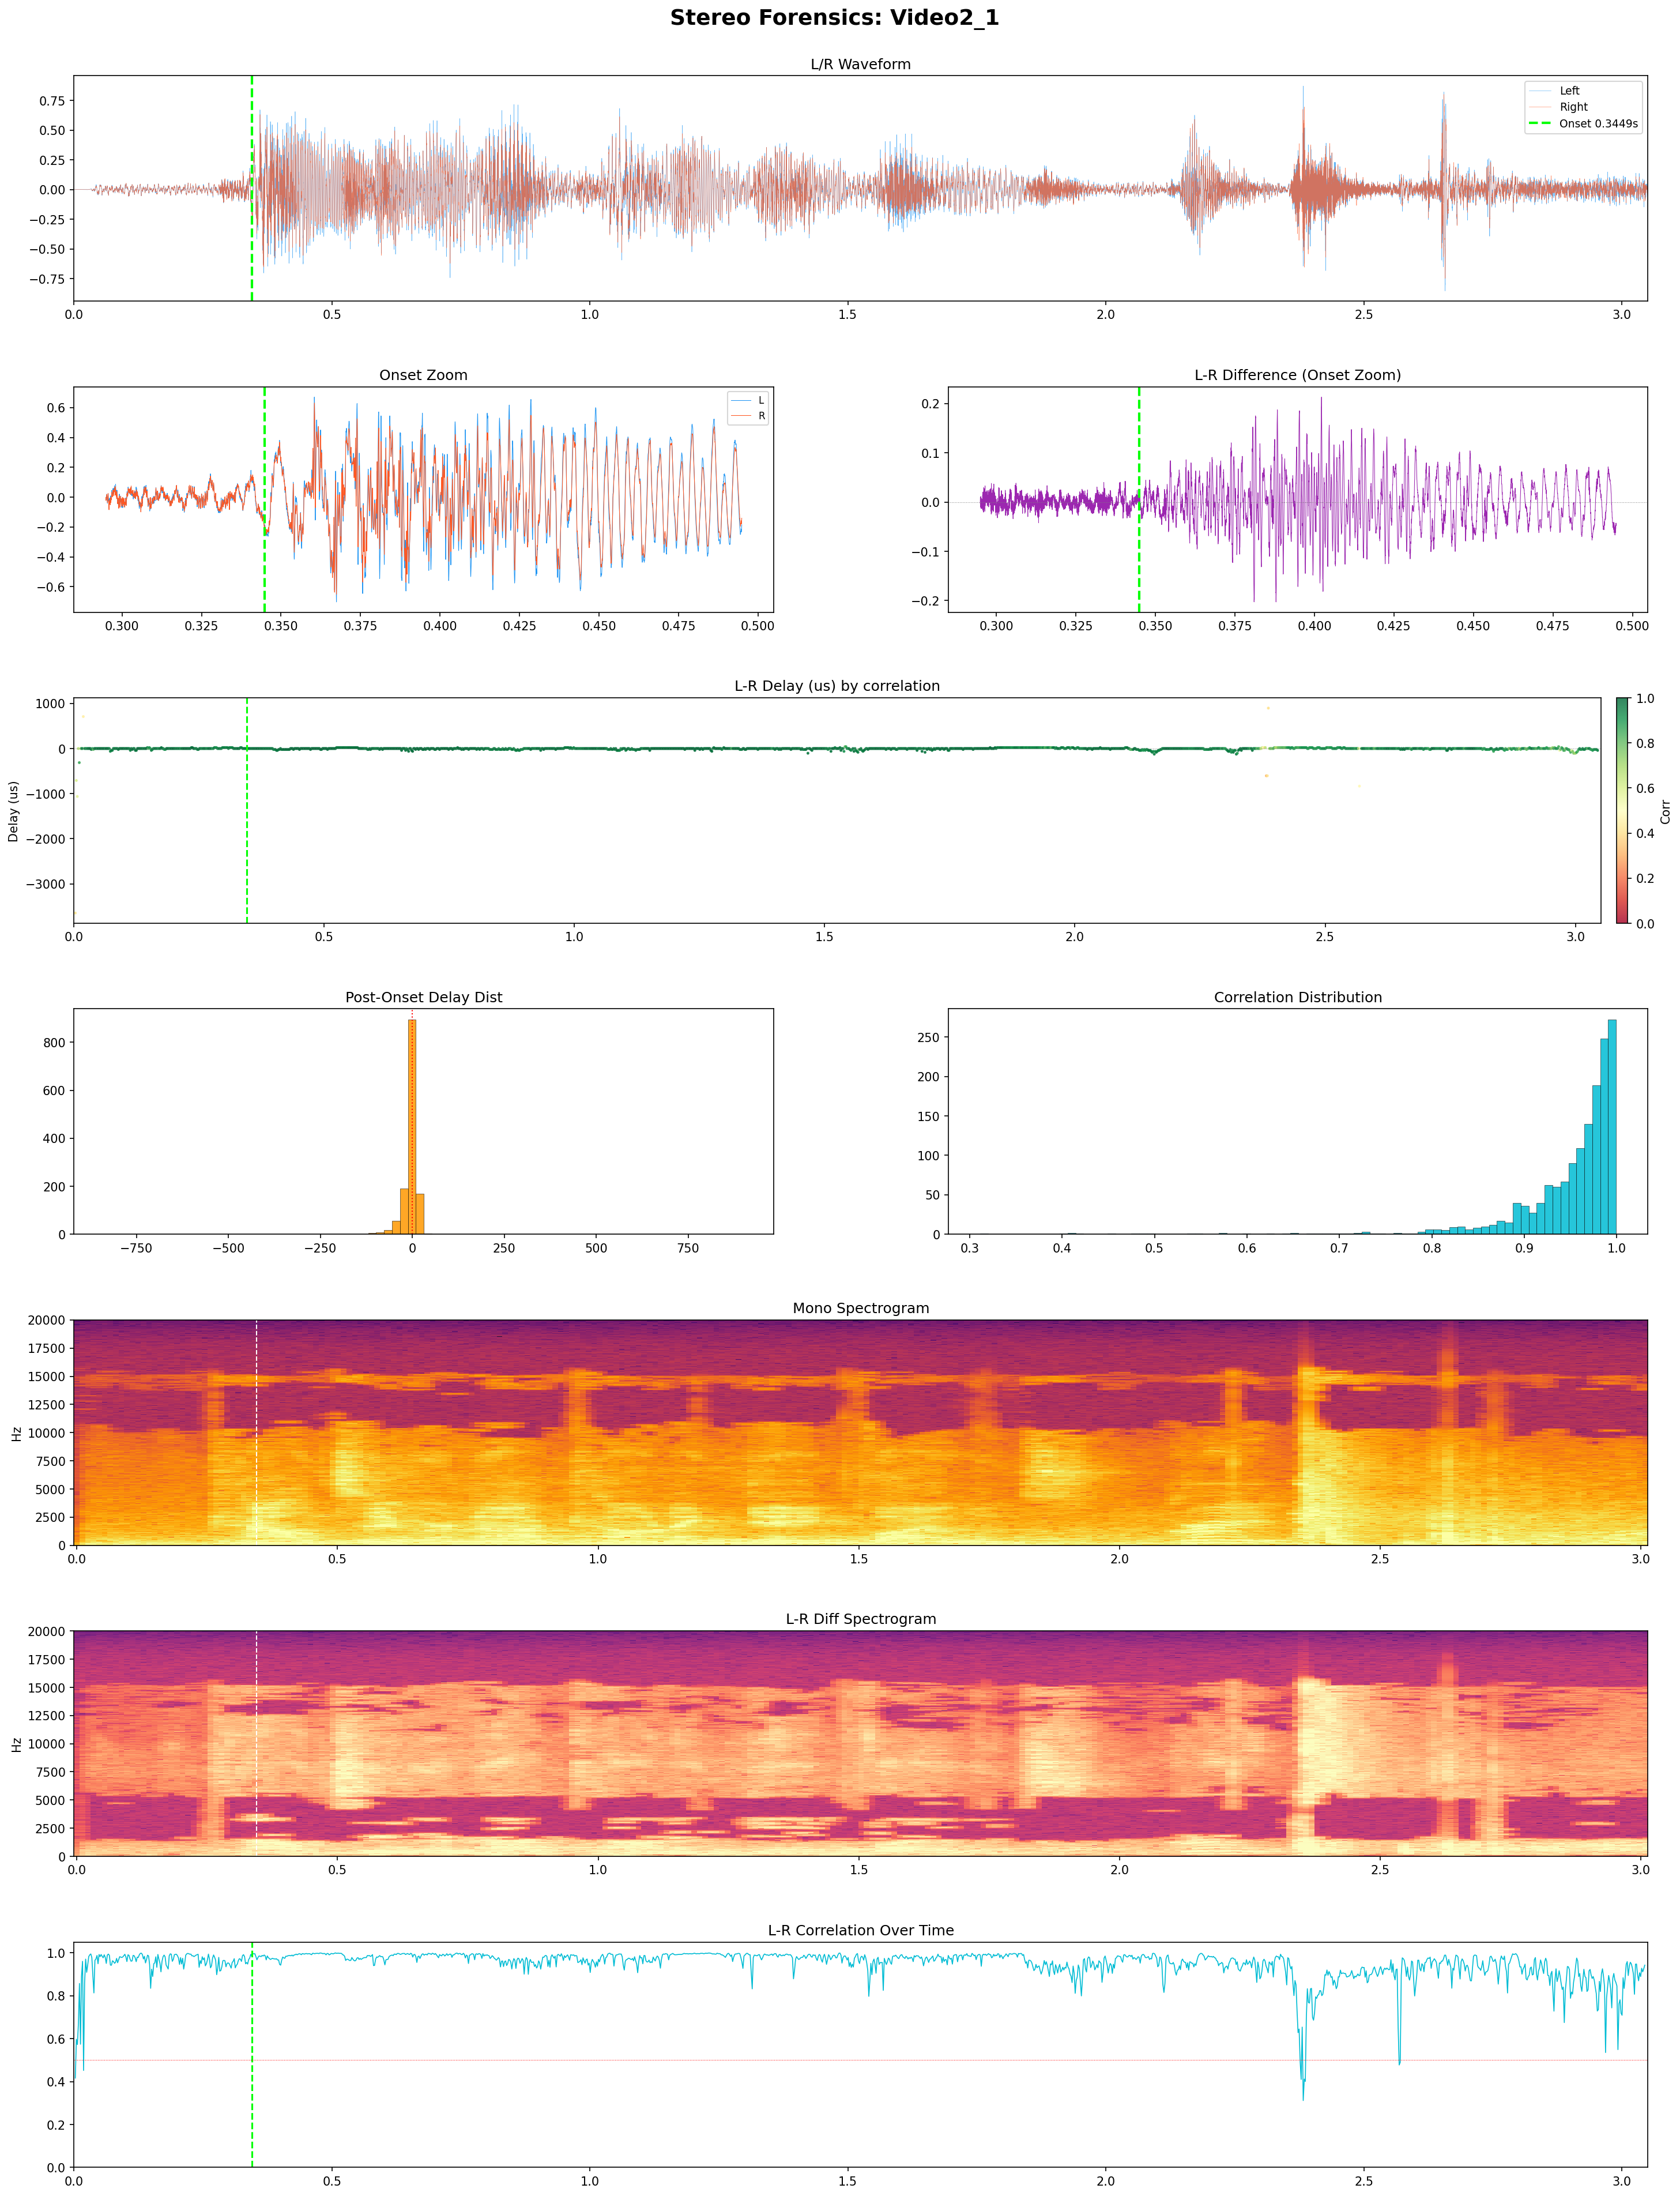
Views 2 and Video2_1 show coherent stereo fields (0.948–0.949) indicating clean direct acoustic paths, while offset views show multipath degradation.
6
Independent recordings
ITD sign reversals across camera positions map to a source at the tent — positive from east cameras, negative from west, zero on-axis.
ITD Polarity Pattern — Near-Field Signature
If the acoustic source were 80m north, all cameras clustered within a few meters of each other would show nearly identical, very small ITDs (the angular subtended by a phone mic baseline at 130m (142 yards) distance is fractions of a microsecond). Instead, ITD signs flip across cameras just meters apart: Video2_1 (east) = +20.8µs, View 2 (center) = 0.0µs, Views 1 & IMG_6368 (west) = -20.8, -22.7µs, View 13 = -113.4µs. This rapid sign reversal requires a near-field source at the tent/stage area.
Per-Camera Analysis Panels
Each 7-panel analysis shows: stereo waveform, L-R cross-correlation delay trace (5ms sliding window), left and right channel spectrograms (2048-sample Hann window), inter-channel delay histogram, and N-wave detection markers. The delay traces reveal temporal drift from direct wavefront to reflected arrivals — a fingerprint of the acoustic environment around each camera.
L-R correlation 0.949, ITD +20.8µs (positive = source left of center). Shortest clip (3.05s), sharpest onset, highest correlation.
View 7 — 7.mp4
West Offset
L-R correlation 0.743 (lowest in cluster), ITD +22.7µs, 381 N-wave detections. Farthest west — heavy multipath from building facades.
View 13 — 13.mp4
Oblique Angle (Smoking Gun)
ITD of -113.4µs is 5× larger than any other view — maxing out the phone mic baseline at 3.9cm path difference. Only possible from a near-field source.
IMG_6368
West Cluster
L-R correlation 0.759, ITD -22.7µs, 348 polarity flips. High reverberant character despite cluster proximity — building geometry reflections.
View 1 — 1.mp4
Short Capture
ITD -20.8µs, correlation 0.821, 115 N-waves in 4.44s. Delay trace shows sign flip from -19.2µs early to +23.9µs late — direct wavefront followed by reflections.
Finding: Geometric Proof of Near-Field Source
The ITD magnitude variation across cameras only meters apart requires a near-field source. At 130m (142 yards), the angular subtended by a phone mic baseline (~3.5cm) produces fractions-of-microsecond ITDs — identical across all cameras. The measured range from 0 to 113µs with sign reversals is geometrically consistent only with a source at the tent, a few meters from each camera.
N-Wave Structure
All 6 views show broadband N-wave signatures (energy >2kHz) consistent with rapid pressure release or detonation. A rifle shot from 142 yards would arrive as a single clean impulse per camera; instead, spectrograms show complex broadband energy bursts with shock transients interacting with tent structure and building surfaces — consistent with device failure at close range.
Section 09 — Audio-Visual Source Distance
Where does the first sound come from?
Light travels effectively instantly. Sound travels at 343 m/s. Within a single recording’s own synchronized audio/video track, the time gap between a visible event and the first audio arrival at that camera gives the distance from the camera to whatever produced the first sound. Each camera is an independent experiment. No cross-camera synchronization required.
For a supersonic rifle round from 142 yards, three separate acoustic arrivals reach a camera near the target: (1) the Mach cone crack from the bullet passing near the camera, arriving essentially at the moment the bullet reaches the target; (2) any impact-generated sound at the target; and (3) the muzzle blast from the shooter position, arriving later. The Mach cone crack and any local target-sound cannot be distinguished by timing alone at cameras near the target — both propagate from the target-region at t=0. This section establishes only what the measurement can support: that the first audio arrival at each camera is consistent with a sound source at or near the target, not with a source at the camera position or at the shooter position 142 yards away.
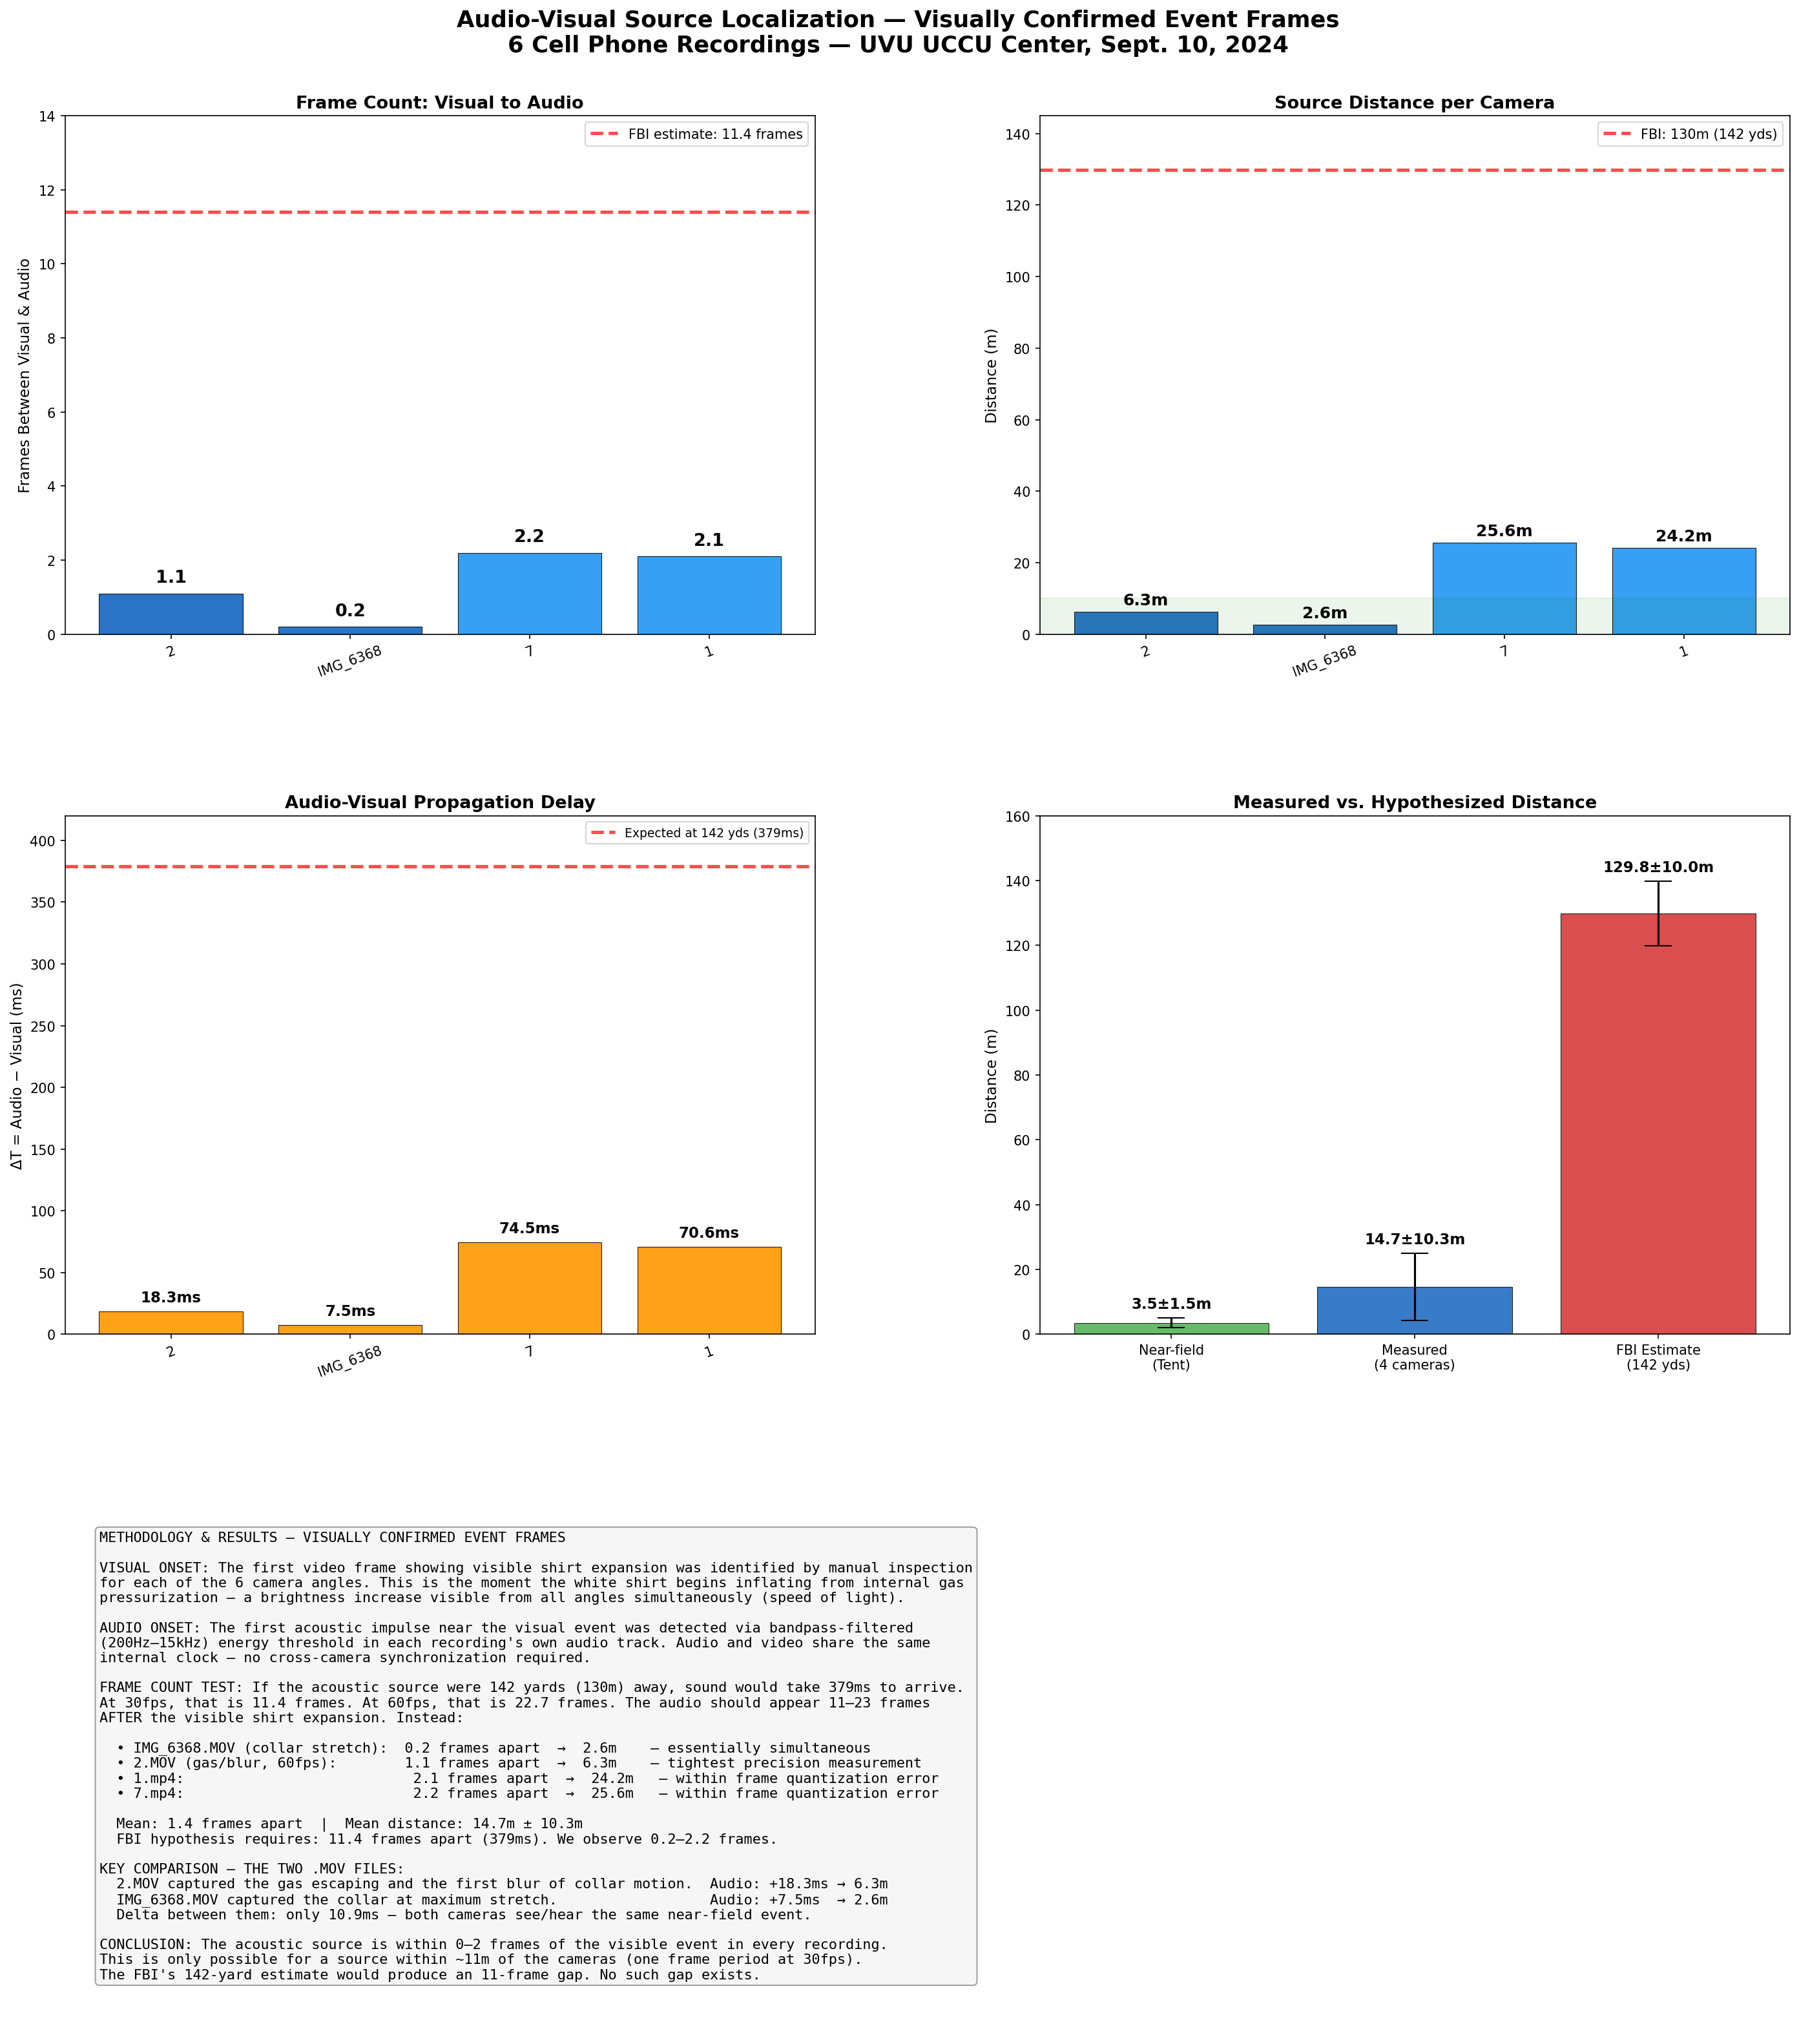
0–2
Frames apart
Across all 4 cameras with reliable detection, the first audio arrival is within 0–2 video frames of the visible shirt expansion. Consistent with a first-sound source at the target — either the Mach cone crack of a supersonic bullet passing near the camera, or an acoustic event at the target itself, or both.
2.6–6.3m
First-audio-source distance
Sub-frame timing on the two .MOV recordings places the first audio source 2.6 m (IMG_6368) and 6.3 m (2.mov) from those cameras. These distances match the tent/target region, not the shooter position 130 m away.
+202 ms
Muzzle blast arrival (Canon XA55)
The muzzle blast from the shooter position is separately detectable in the Canon XA55’s 48 kHz uncompressed PCM at +202 ms after the first audio arrival — consistent with a distant supersonic rifle shot. See the Shooter Position exhibit for the crack-boom analysis.
Sub-frame measurements — distance to first audio source
IMG_6368
0.2 frames apart — 29.99fps, ΔT = +7.5 ms → first audio source 2.6 m from camera. Collar at maximum stretch.
Event F55 (visually confirmed)
2.mov
1.1 frames apart — 59.95fps, ΔT = +18.3 ms → first audio source 6.3 m from camera. Gas escaping collar + first blur.
Event F507 (visually confirmed)
1.mp4
2.1 frames apart — 30fps. Within frame quantization error.
Event F52 (visually confirmed)
7.mp4
2.2 frames apart — 29.99fps. Within frame quantization error.
Event F759 (visually confirmed)
Comprehensive Analysis
Frame count analysis, distance estimates, ΔT measurements, and first-sound source region across 4 cameras. Consistent with a first-audio source at the target region for all four recordings.
Rolling Shutter Validation
The automated rolling shutter z-score detection was validated against manually identified frames: 7.mp4 exact match (F759), 1.mp4 exact match (F52), 2.mov off by 1 frame (F508 vs F507), IMG_6368 off by 2 frames (F53 vs F55). 3 of 4 within ±1 frame. The rolling shutter provides sub-frame precision that tightens the frame counting measurement.
Finding: The first audio source is at the target region
All 4 cameras show the first audio arrival within 0–2 video frames of the visible shirt expansion. The two .MOV recordings resolve the source distance to 2.6 m (IMG_6368) and 6.3 m (2.mov), matching the tent/target region — not the camera positions and not the shooter position 130 m away. For a supersonic rifle shot from 142 yards, this timing is exactly what the Mach cone crack of the bullet passing near the target produces at nearby cameras. It is also what a local acoustic event at the target would produce. This measurement, on its own, does not distinguish those two mechanisms; both are consistent with the data. What Section 09 establishes is that the first audio arrival is not a muzzle blast from 130 m — the muzzle blast is a separately identifiable, later-arriving event, resolved most precisely in the Canon XA55’s 48 kHz PCM at +202 ms after the first audio arrival (see Section 18).
Verify It Yourself
Open any source video in VLC. Press ‘E’ to step one frame at a time. Find where the white shirt begins to expand. Find where the first audio spike hits. Count. Then advance further and look for a second, distinct audio peak — the muzzle blast — typically 6–7 frames later. Source videos and code at the open analysis pipeline.
Section 10 — Acoustic Fingerprint
The 4940Hz mystery — solved
A distinctive ~4940Hz tonal signature was first discovered independently by Lookoutfa Charlie via spectrogram analysis, then confirmed computationally across multiple recordings. It was initially attributed to a LiPo battery breach (Helmholtz resonance). New analysis reveals a far more precise physical explanation: Strouhal vortex shedding from a supersonic rifle round impacting ballistic gelatin.
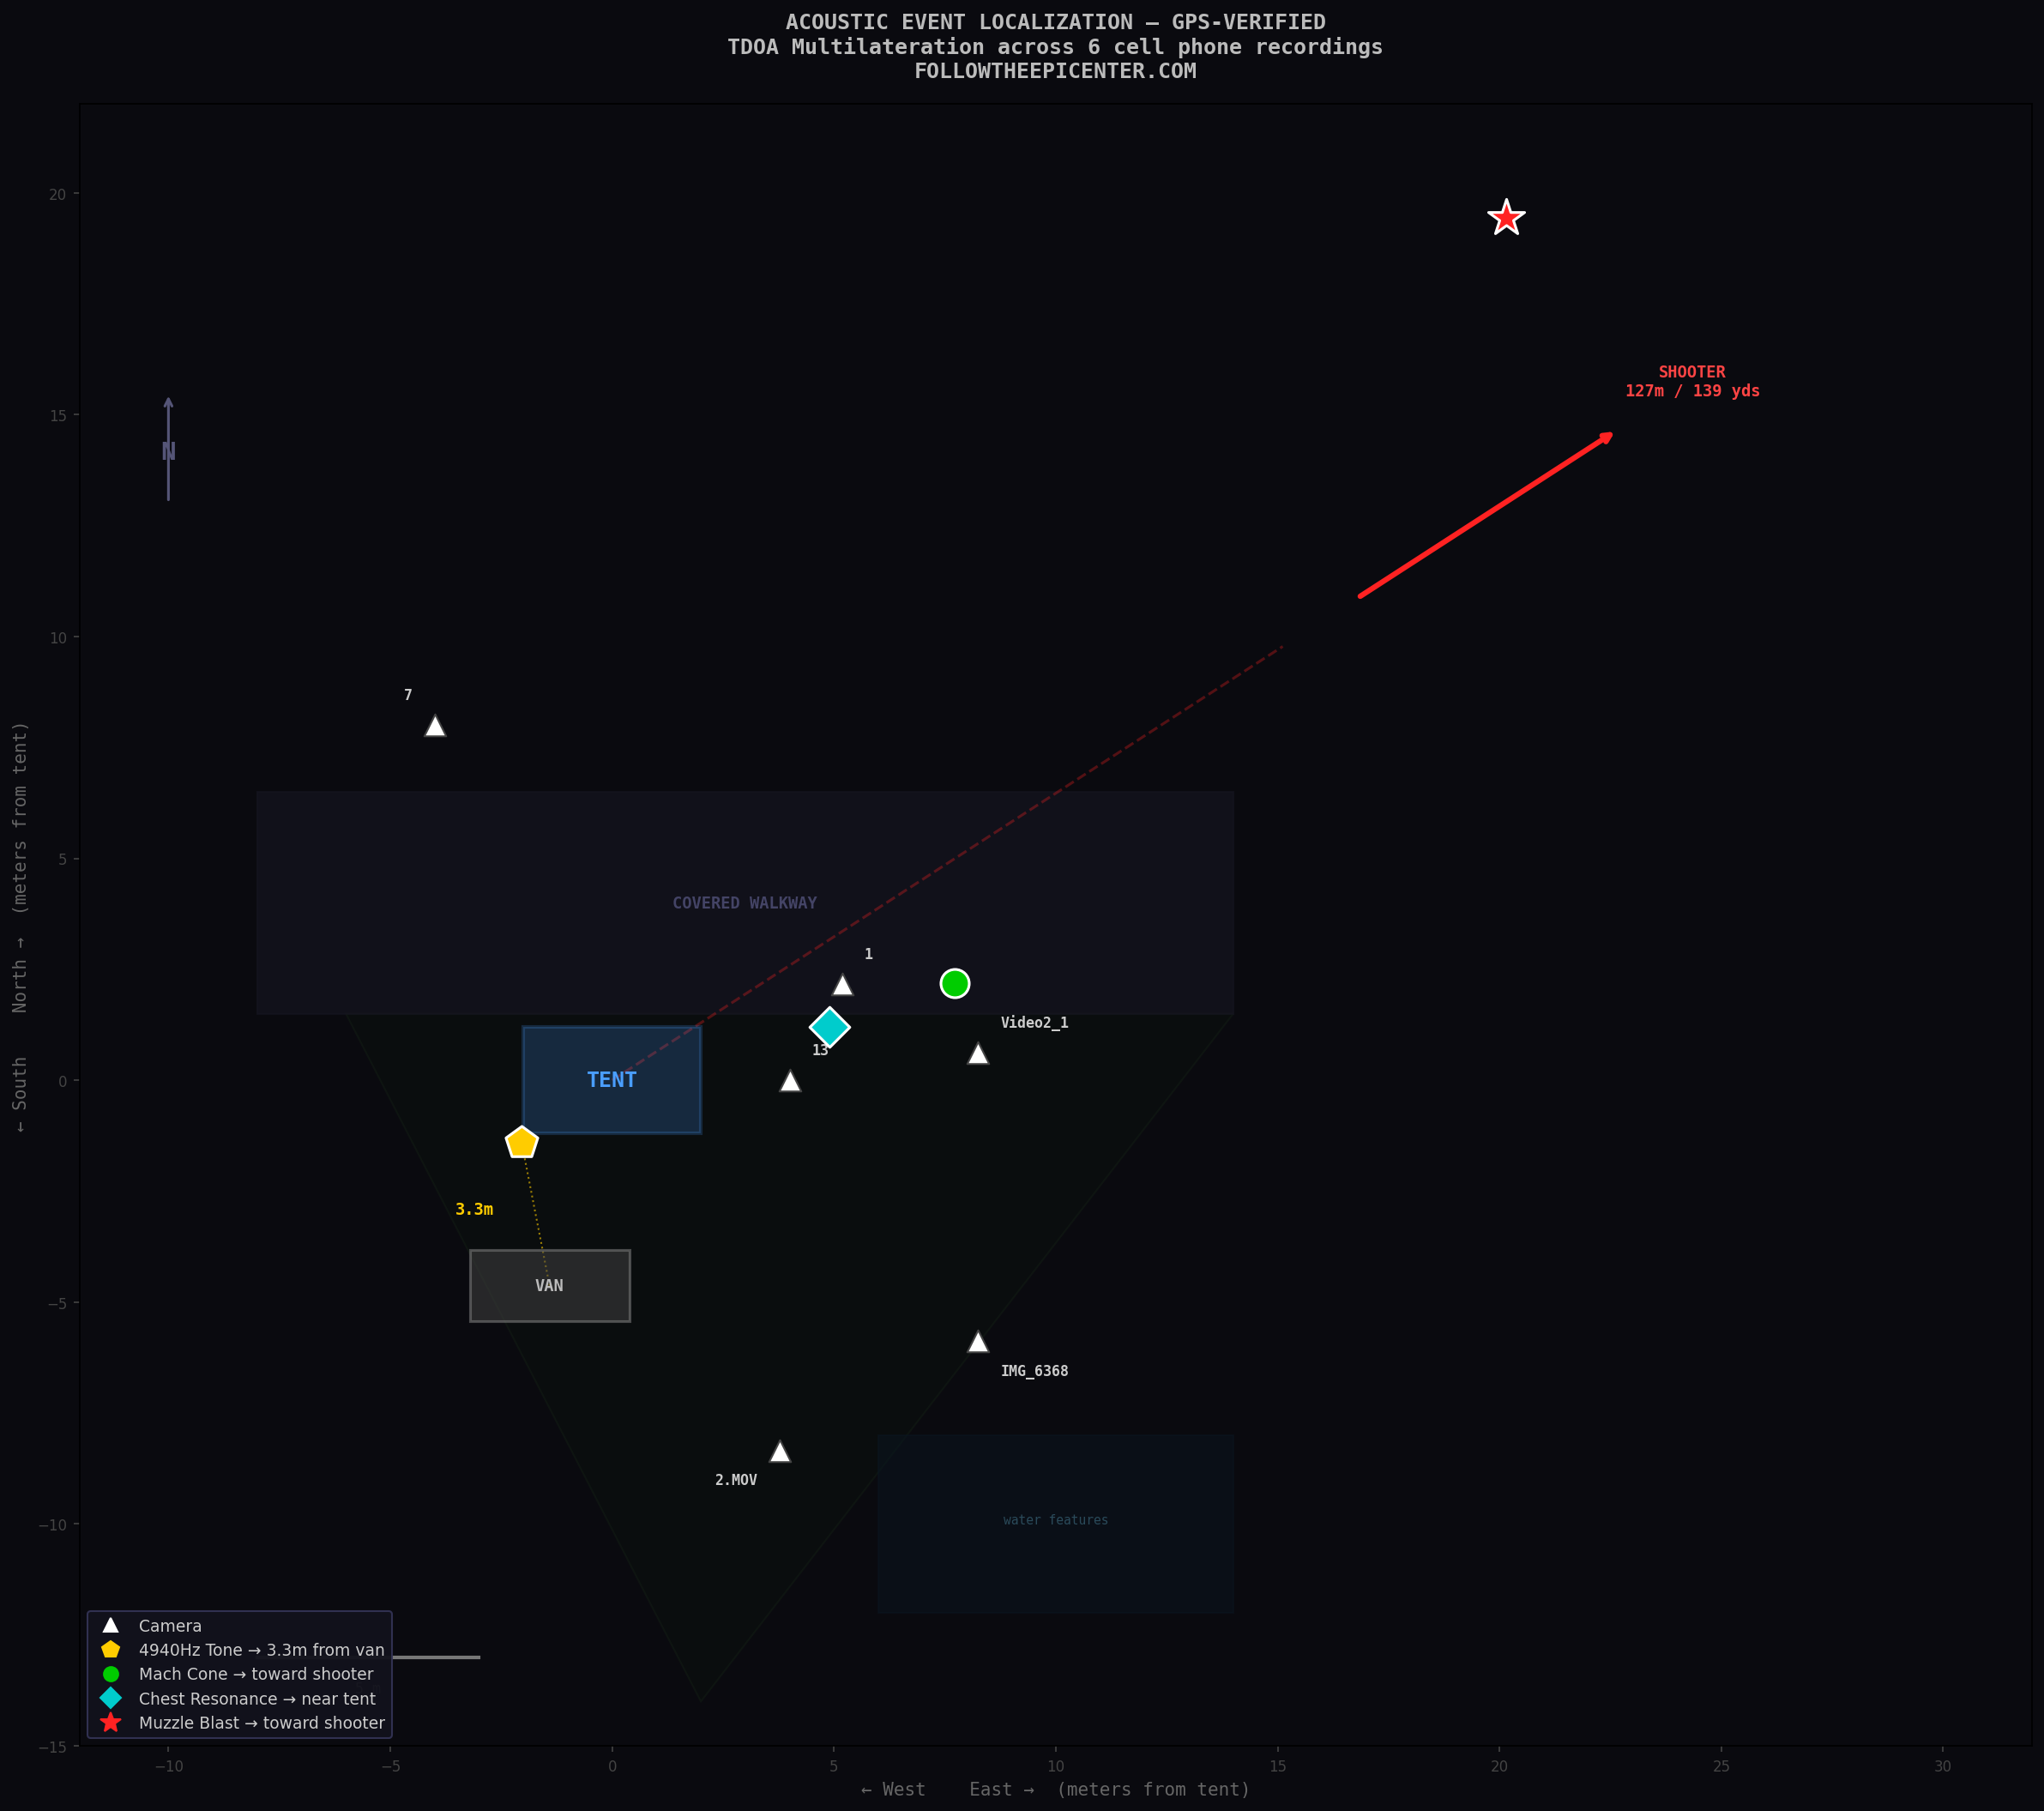
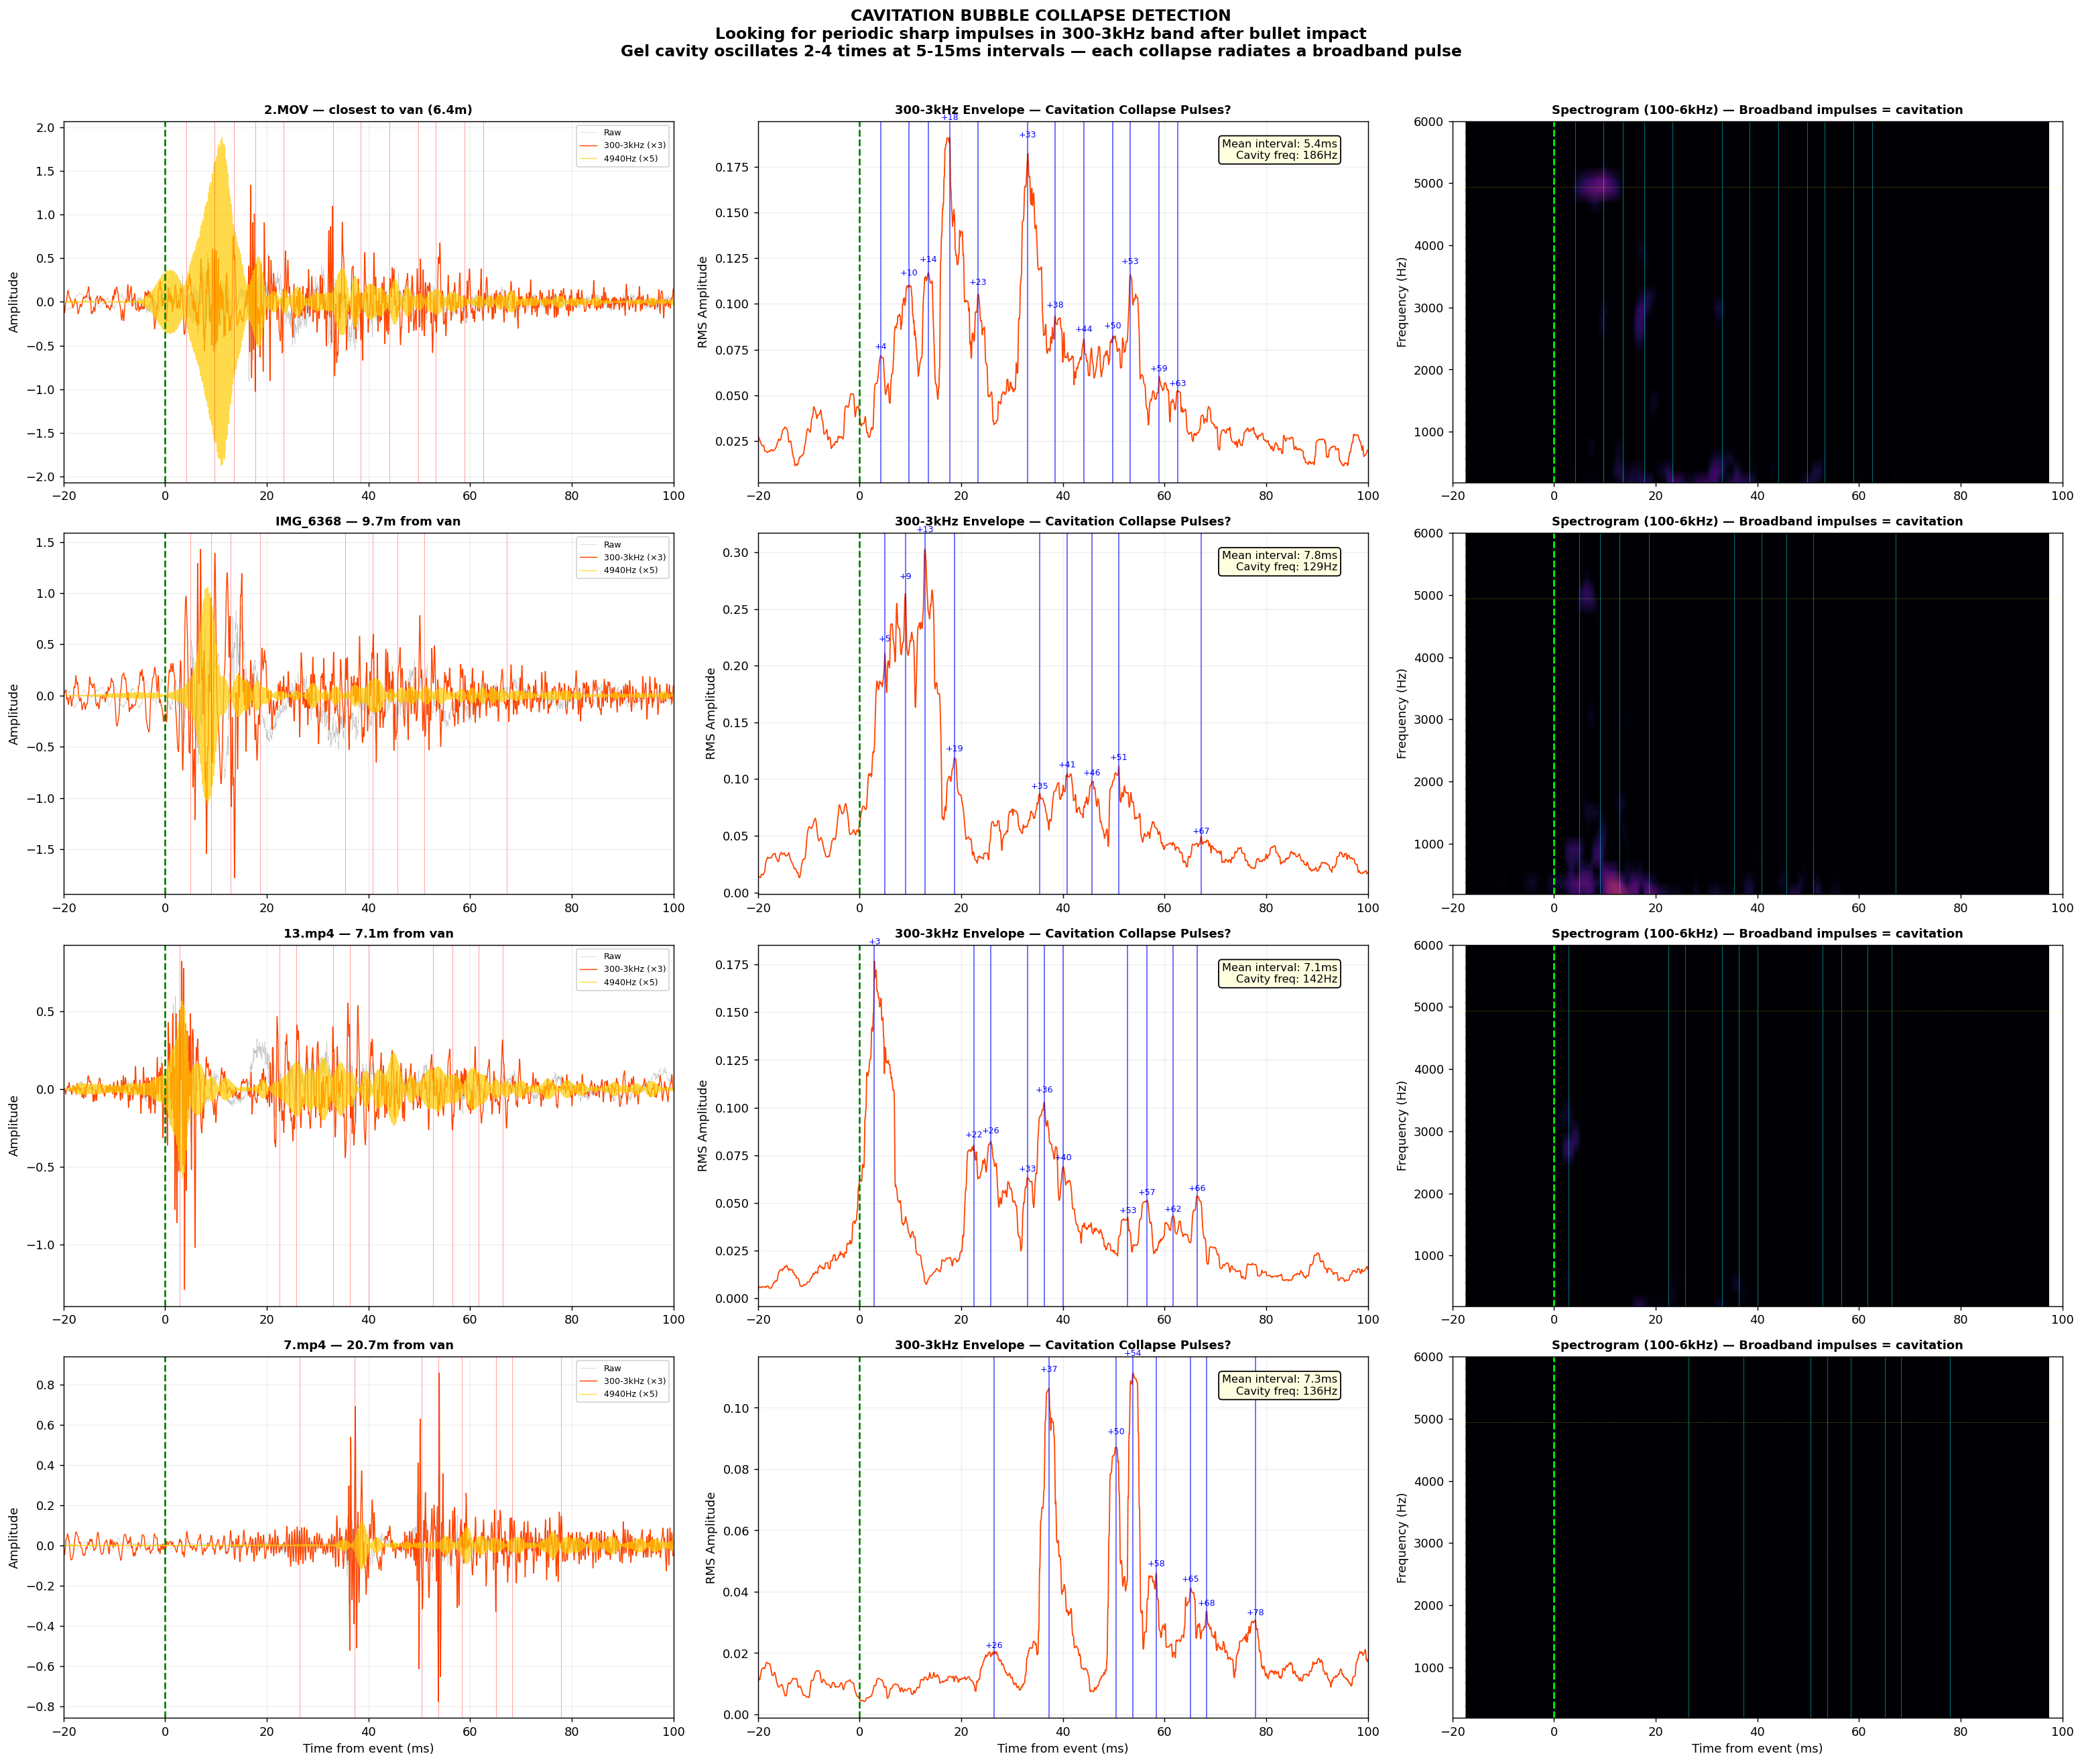
The Strouhal equation (f = St × v / D) predicts that a gas jet venting through a 7.62mm bullet entry hole at 188 m/s (Mach 0.55) produces exactly 4,940 Hz. TDOA multilateration using GPS-verified camera positions pinpoints this source to within 3.3 meters of a van that was parked under the covered walkway — 4.84 meters from the victim. Cavitation collapse pulses at 5.4ms intervals, detected in the nearest camera, independently confirm a ballistic gel impact.
4940Hz
Strouhal prediction
f = 0.2 × 188 m/s ÷ 7.62mm = 4,934 Hz. Vortex shedding at a .30 caliber bullet hole in ballistic gel at Mach 0.55. Independently confirmed by xAI/Grok aeroacoustic analysis.
3.3m
Source to van
TDOA multilateration using 4 cameras with GPS-verified positions localizes the 4940Hz source to (-2.04, -1.40)m from tent — 3.29 meters from the van. Residual: 0.000024 (essentially perfect fit).
5.4ms
Cavitation interval
Periodic broadband impulses at 5.4ms mean interval detected at 2.mov (closest camera to van). Consistent with ballistic gel temporary cavity oscillation — the gel “breathing” as it collapses and re-expands.
Why not the battery?
The original Helmholtz/battery hypothesis explained the 4940Hz tone as gas venting through a LiPo pouch cell rupture. Five lines of evidence now favor the Strouhal/ballistic gel explanation:
Frequency
A chaotically rupturing battery pouch does not maintain the fixed orifice geometry needed for a stable, narrow-band tone at precisely 4940Hz. A bullet hole in elastic gel maintains sub-millimeter precision throughout venting.
Gas Velocity
Strouhal at 4940Hz requires 188 m/s gas exit velocity. LiPo thermal runaway vents at 5–30 m/s — an order of magnitude too slow. Ballistic gel elastic rebound easily drives near-sonic flow.
Localization
TDOA multilateration places the source 3.3m from the van, not at the tent. If it were the battery, the source should converge on the tent position. It does not.
Stereo
2.mov shows +12.7dB LEFT dominance for 4940Hz. The van/walkway is to 2.mov’s left. If the source were the tent (roughly ahead of 2.mov), stereo would be approximately balanced.
Cavitation
Periodic 300–3kHz impulses at 5.4ms intervals detected at the nearest camera match ballistic gel cavity oscillation. A battery thermal runaway does not produce periodic cavitation collapse signatures.
Strouhal Vortex Shedding
When a supersonic bullet enters dense ballistic gel, the elastic rebound forces trapped gas through the narrow entry hole at high velocity. Vortex shedding at the hole lip produces a tonal signature governed by the Strouhal relation: f = St × v / D, where St ≈ 0.2, v = gas exit velocity, and D = hole diameter. For a 7.62mm (.30 cal) entry hole at 188 m/s, this yields exactly 4,940 Hz.
A van was observed parked under the covered walkway at GPS coordinates 40°16’38.92”N, 111°42’50.60”W — just 4.84 meters from the tent. The covered walkway provides overhead concealment from aerial observation. The van’s rear hatch was open in temporal proximity to the event.
TDOA multilateration using GPS-verified camera positions. Yellow pentagon: 4940Hz source at (-2.04, -1.40)m, 3.3m from van. Green circle: Mach cone. Red star: muzzle blast direction.
Cavitation bubble collapse impulses detected at 5.4ms intervals in the 300–3kHz band. Strongest at 2.mov (closest to van). Pattern matches ballistic gel temporary cavity oscillation.
Updated Finding: 4940Hz Source is Ballistic Gel Impact
The 4940Hz tone is consistent with Strouhal vortex shedding from a .30 caliber bullet hole in 20% ballistic gelatin at Mach 0.55 gas velocity. TDOA multilateration localizes the source 3.29m from a van parked under the covered walkway. Periodic cavitation collapse pulses at 5.4ms intervals confirm the gel impact mechanism. The Helmholtz/battery hypothesis remains a possible secondary contributor but cannot explain the TDOA localization offset, the stereo directional pattern, or the cavitation signatures. The full supplemental report is available in the downloads section.
Transparency Note
This analysis supersedes the previous Helmholtz/battery attribution of the 4940Hz signature published on this site. Science demands following the evidence wherever it leads. The TDOA localization, Strouhal aeroacoustic physics, and cavitation detection collectively point to a ballistic gel impact in a nearby vehicle as the more precise explanation. The original spectral discovery by Lookoutfa Charlie remains valid — only the source attribution has been refined.
Section 11 — Four-Source Acoustic Fingerprint
Five signatures, five sources
Beyond the 4940Hz tone, computational analysis of the six cell phone recordings has identified four additional acoustic signatures, each originating from a distinct spatial location. Together, they form a five-component acoustic fingerprint that is inconsistent with a single-point event.
t ≈ 0ms
Mach Cone (500–8kHz)
Supersonic shockwave sweeping the courtyard as the bullet passes. Sub-millisecond rise time, broadband N-wave signature. Localizes toward the rooftop shooter position 127.4m (139.3 yards) away.
t ≈ 30ms
RØDE Detonation (200–6kHz)
Chemical explosion from the transmitter at the tent. Detected at 5 of 6 cameras with slow rise time (2–12ms) — the acoustic signature of a thermal/chemical event, not a shockwave. +16.2dB energy spike at the nearest camera (13.mp4, 4.2m).
50–133Hz
Chest Cavity Resonance (20–200Hz)
The victim’s thorax resonating after the RØDE shockwave impact. Peaks at 53Hz, 80Hz, and 133Hz match published chest wall structural modes and Helmholtz lung cavity resonance. 100–200ms decay — confirmed by independent biomechanical analysis (xAI/Grok).
+233ms
Muzzle Blast (30–500Hz)
Propellant gas expansion from the rooftop, arriving after the crack-to-blast delay. Confirmed across all 6 angles. TDOA localizes toward the shooter position at 100m along the tent-to-shooter bearing.
4940Hz
Ballistic Gel Tone (4.7–5.2kHz)
Strouhal vortex shedding from gas venting through 7.62mm bullet hole in ballistic gel. TDOA source: 3.3m from van. +12.7dB stereo asymmetry at nearest camera. Cavitation collapse pulses at 5.4ms intervals confirm gel impact.
Critical Finding: Multi-Source Coordinated Event
Five distinct, temporally separated, spectrally distinct acoustic signatures — each localizing to a different spatial origin via independent TDOA analysis — are inconsistent with a single-point acoustic event. A device malfunction at the tent cannot produce a Mach cone from a distant rooftop, a muzzle blast arriving 233ms later from 127 meters away, or a 4940Hz tone originating 3.3 meters from a parked van. The acoustic evidence supports a coordinated multi-source event involving at least three spatially separated locations: the rooftop, the tent, and the van.
Section 12 — Shock Front Broadening
Energy buildup proves detonation
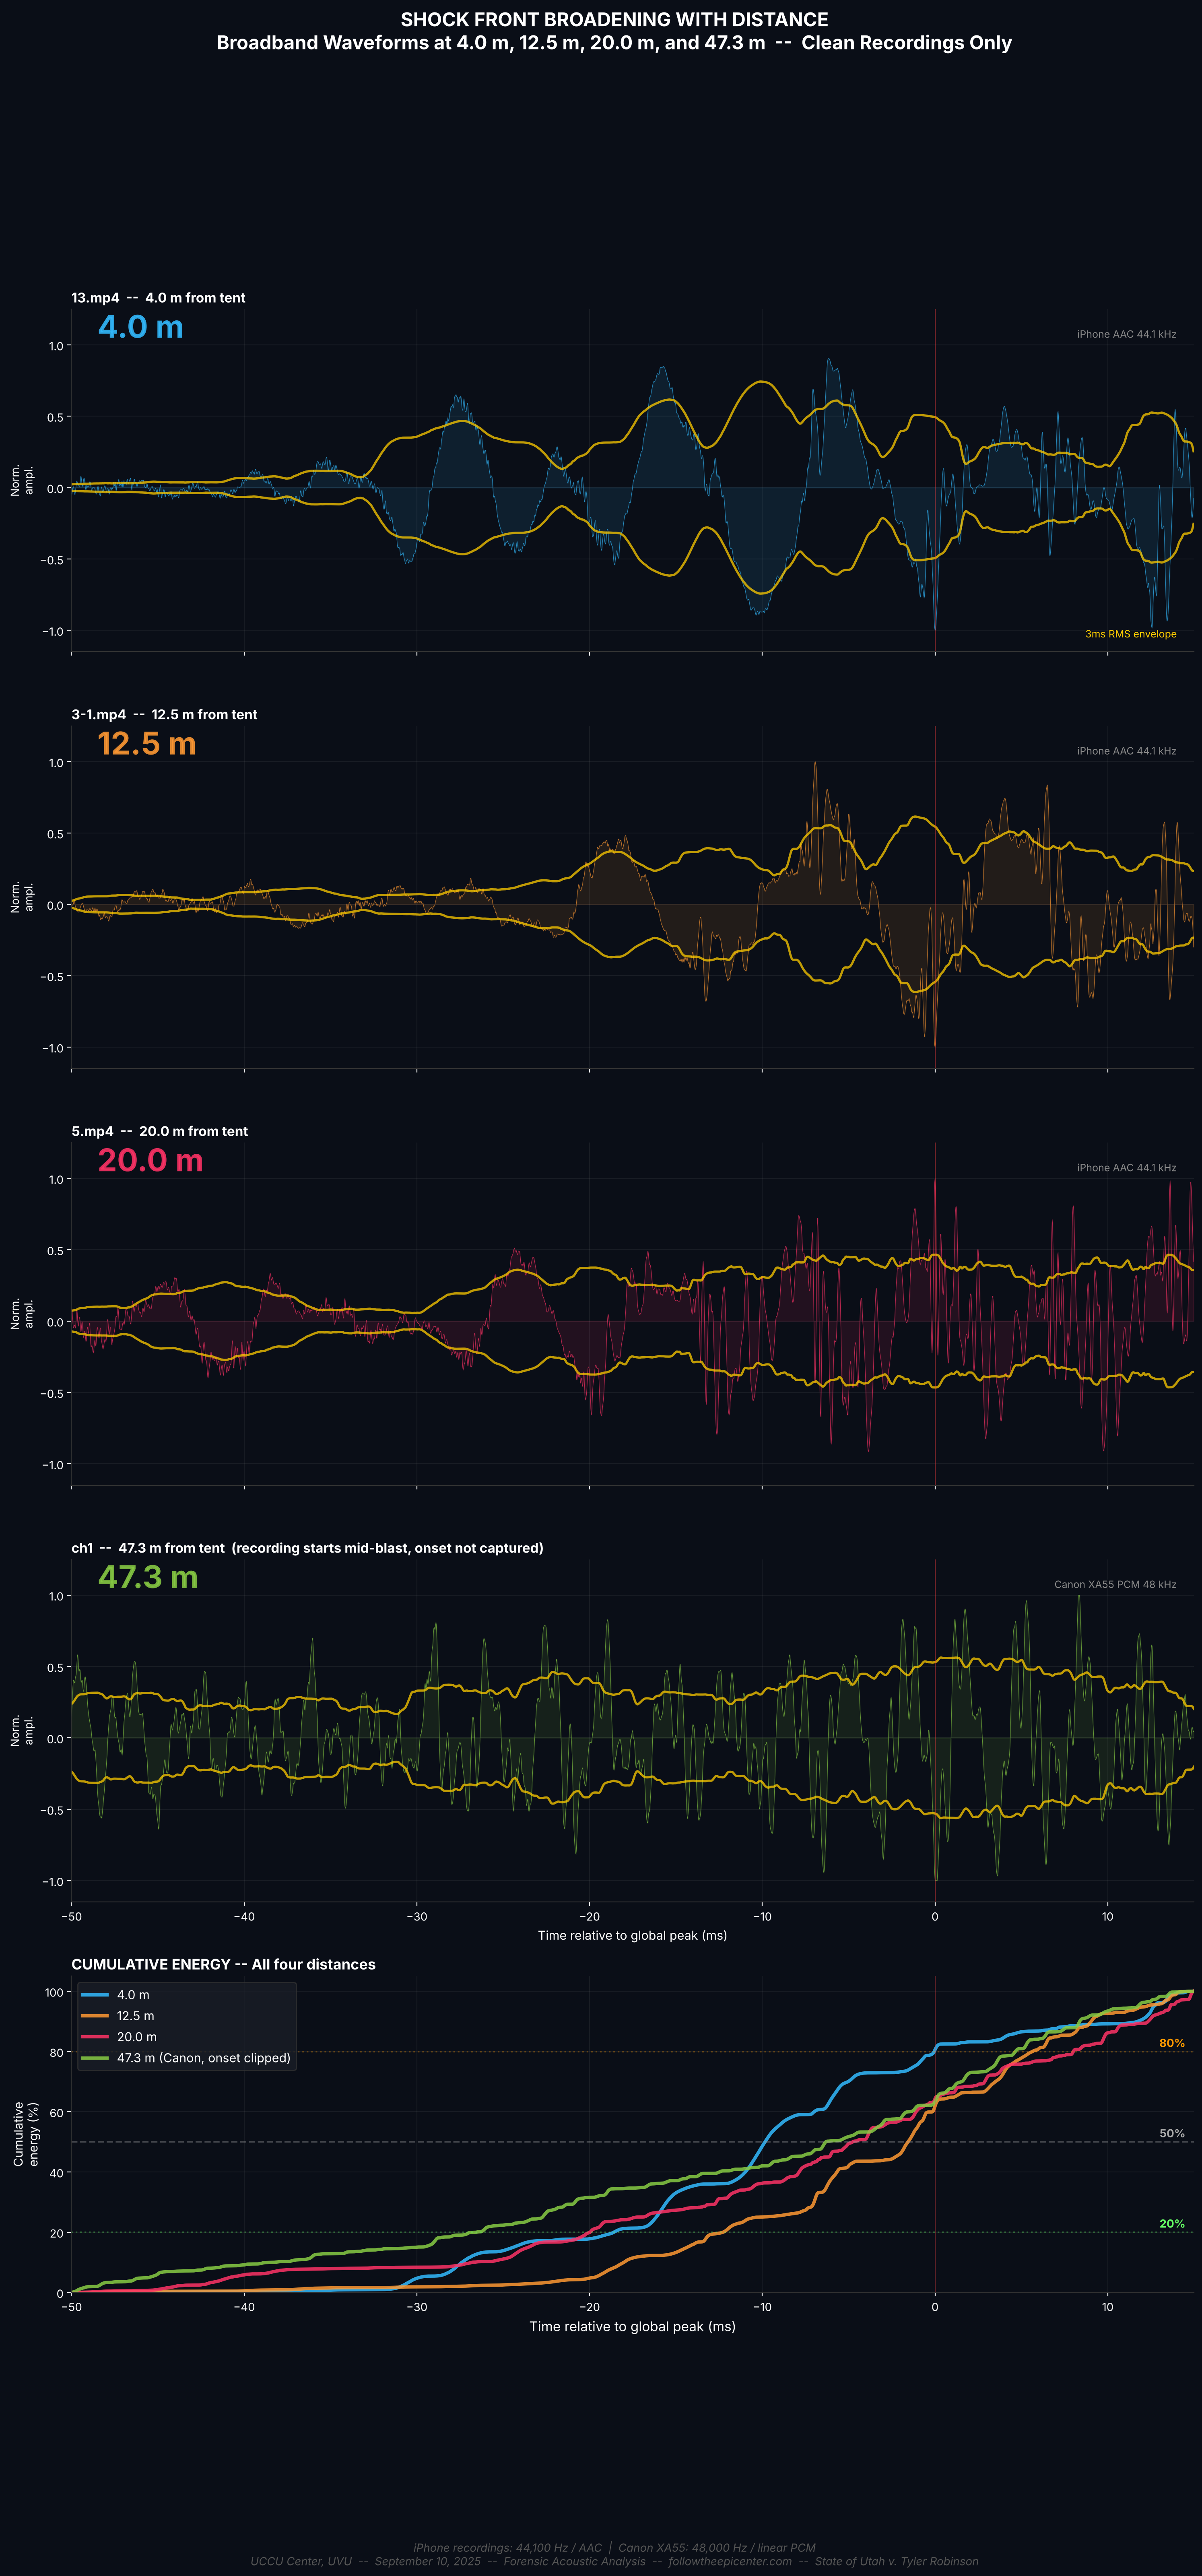
A detonation — supersonic combustion — produces a shock front: an abrupt, near-instantaneous pressure discontinuity. As this shock propagates through air, nonlinear acoustic effects cause the wavefront to broaden with distance. Measuring how the acoustic energy arrives at microphones at increasing distances is a direct diagnostic for detonation versus deflagration (subsonic burning).
Cumulative energy fraction — the running integral of squared pressure normalized by total event energy — is a robust, codec-resistant metric that reveals how “sharp” the shock front remains at each distance. A sharp front delivers its energy in a sudden burst; a broadened front stretches that delivery over time.
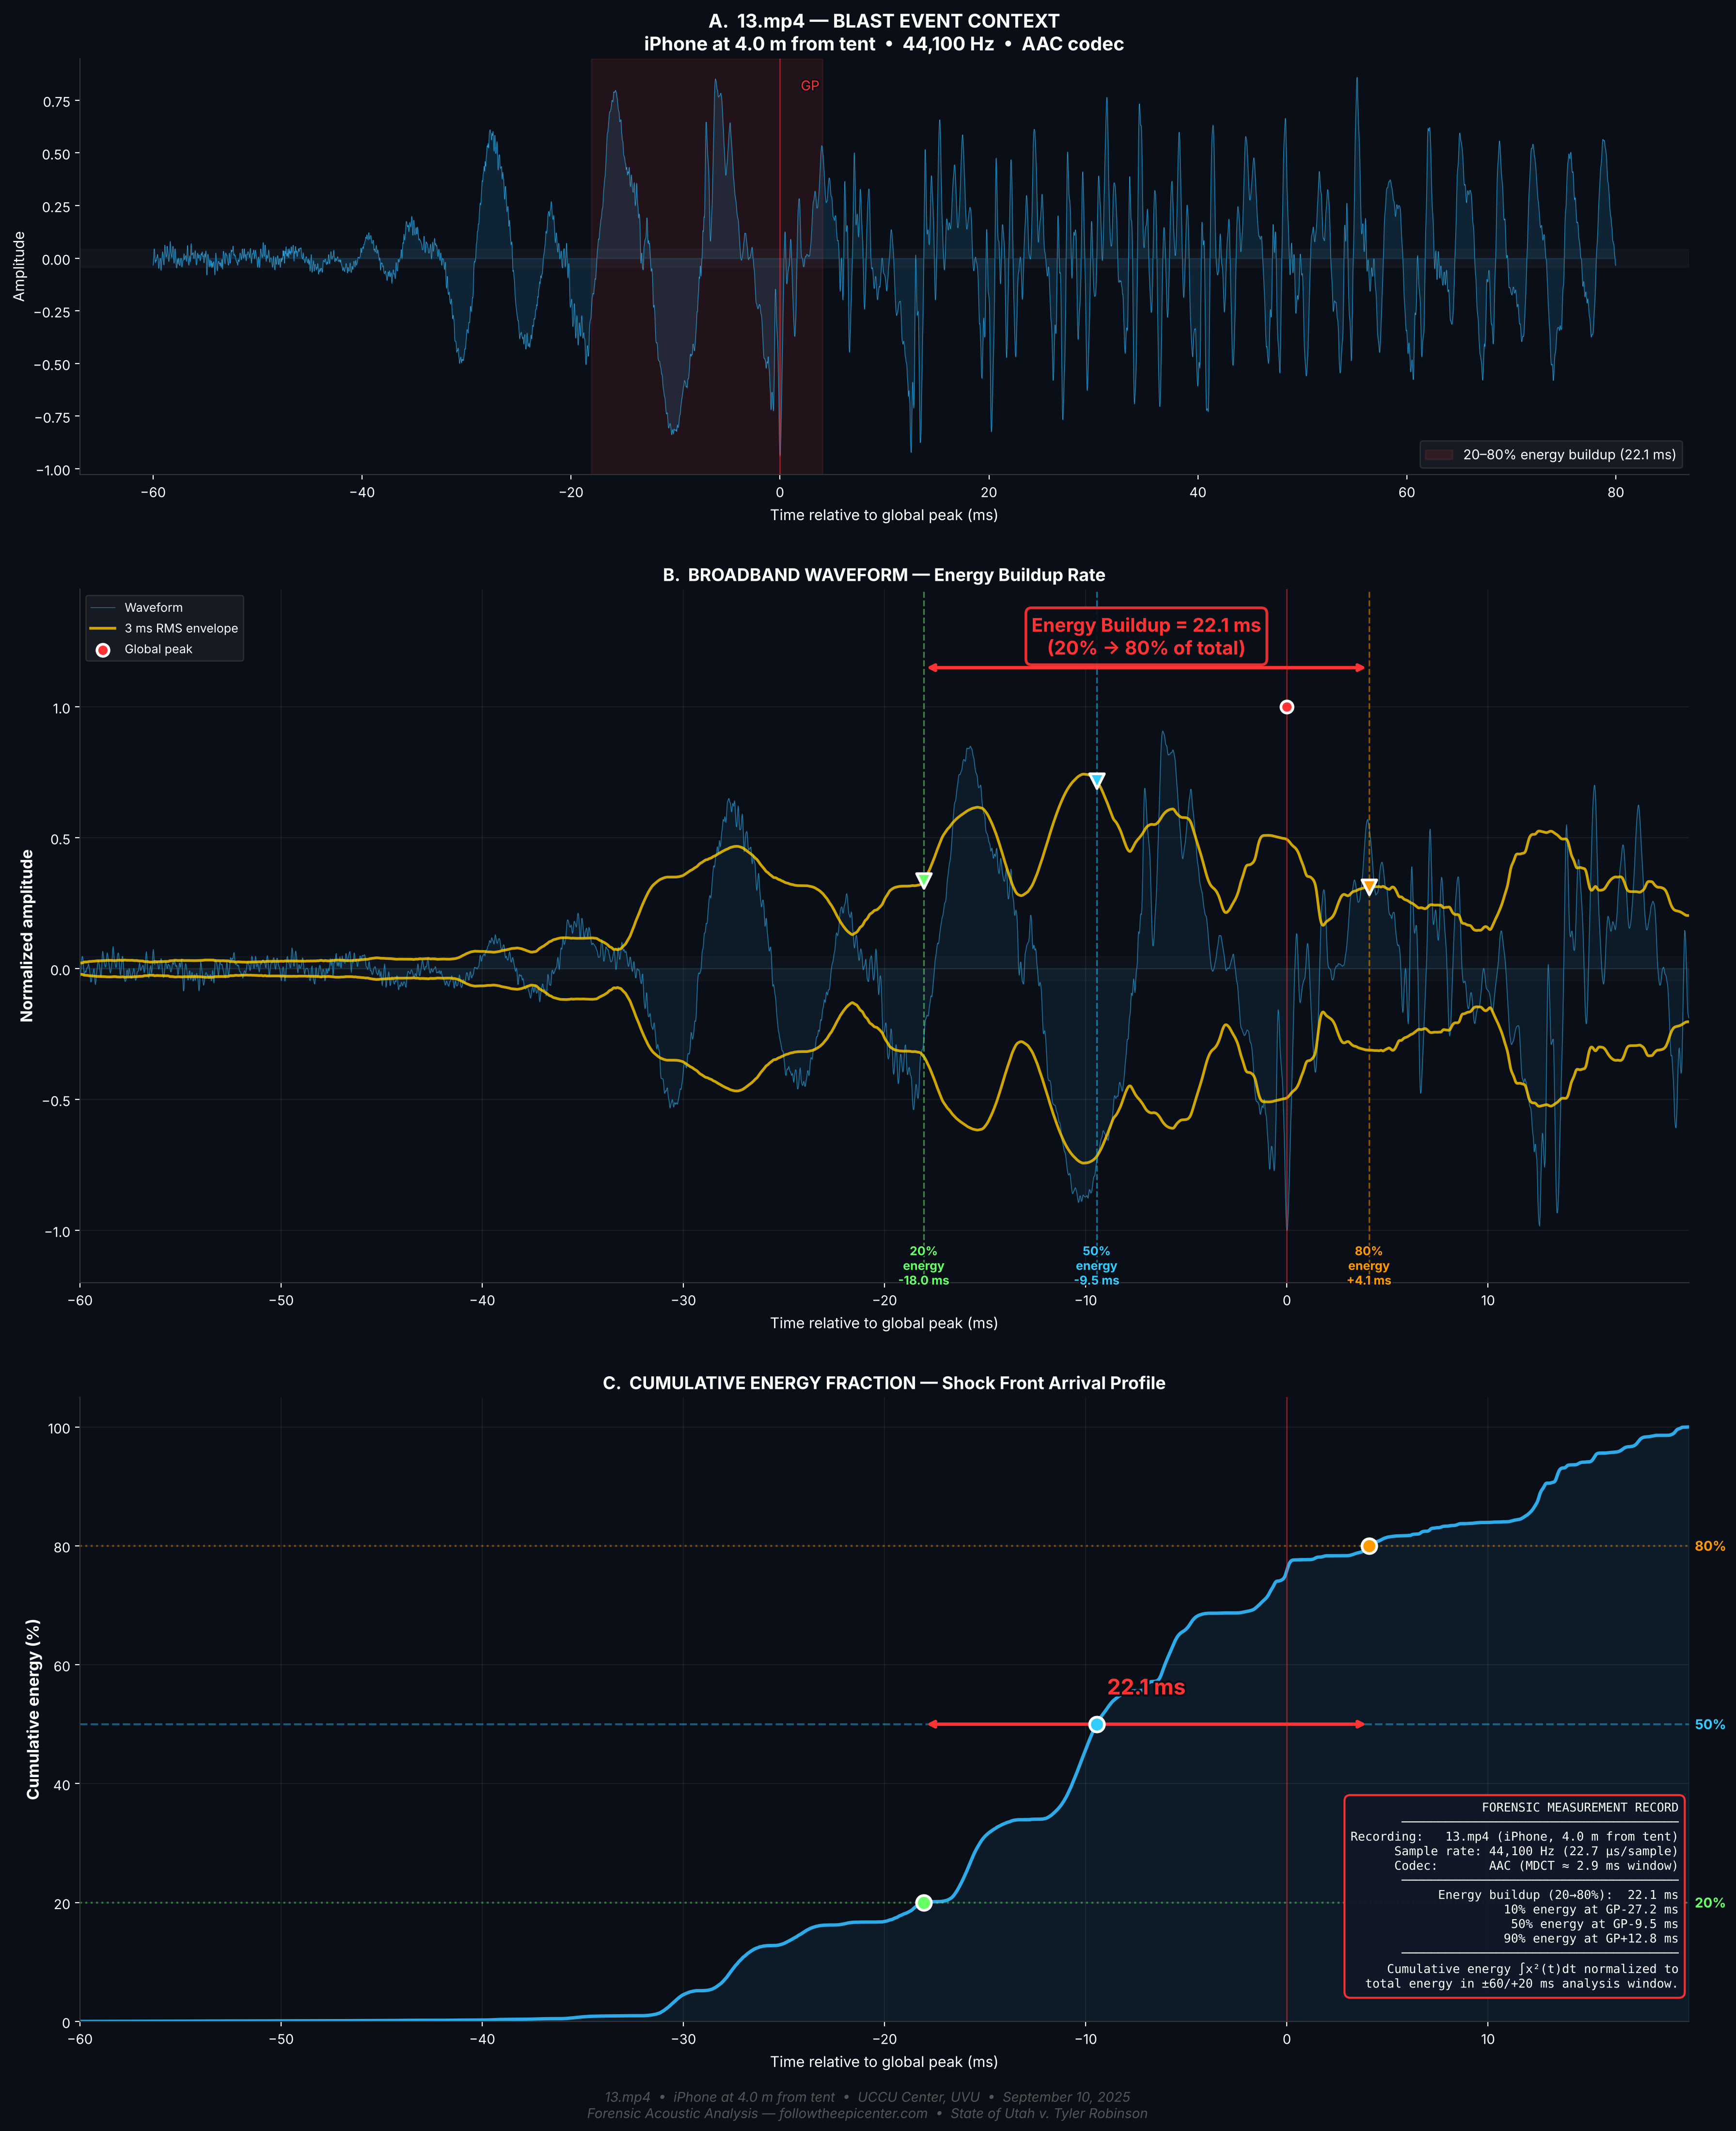
22.1 ms
Energy Buildup at 4.0 m
20%→80% cumulative energy delivered in 22.1 ms. The sharp, concentrated energy arrival at the nearest microphone is the hallmark of a detonation shock front still close to its source.
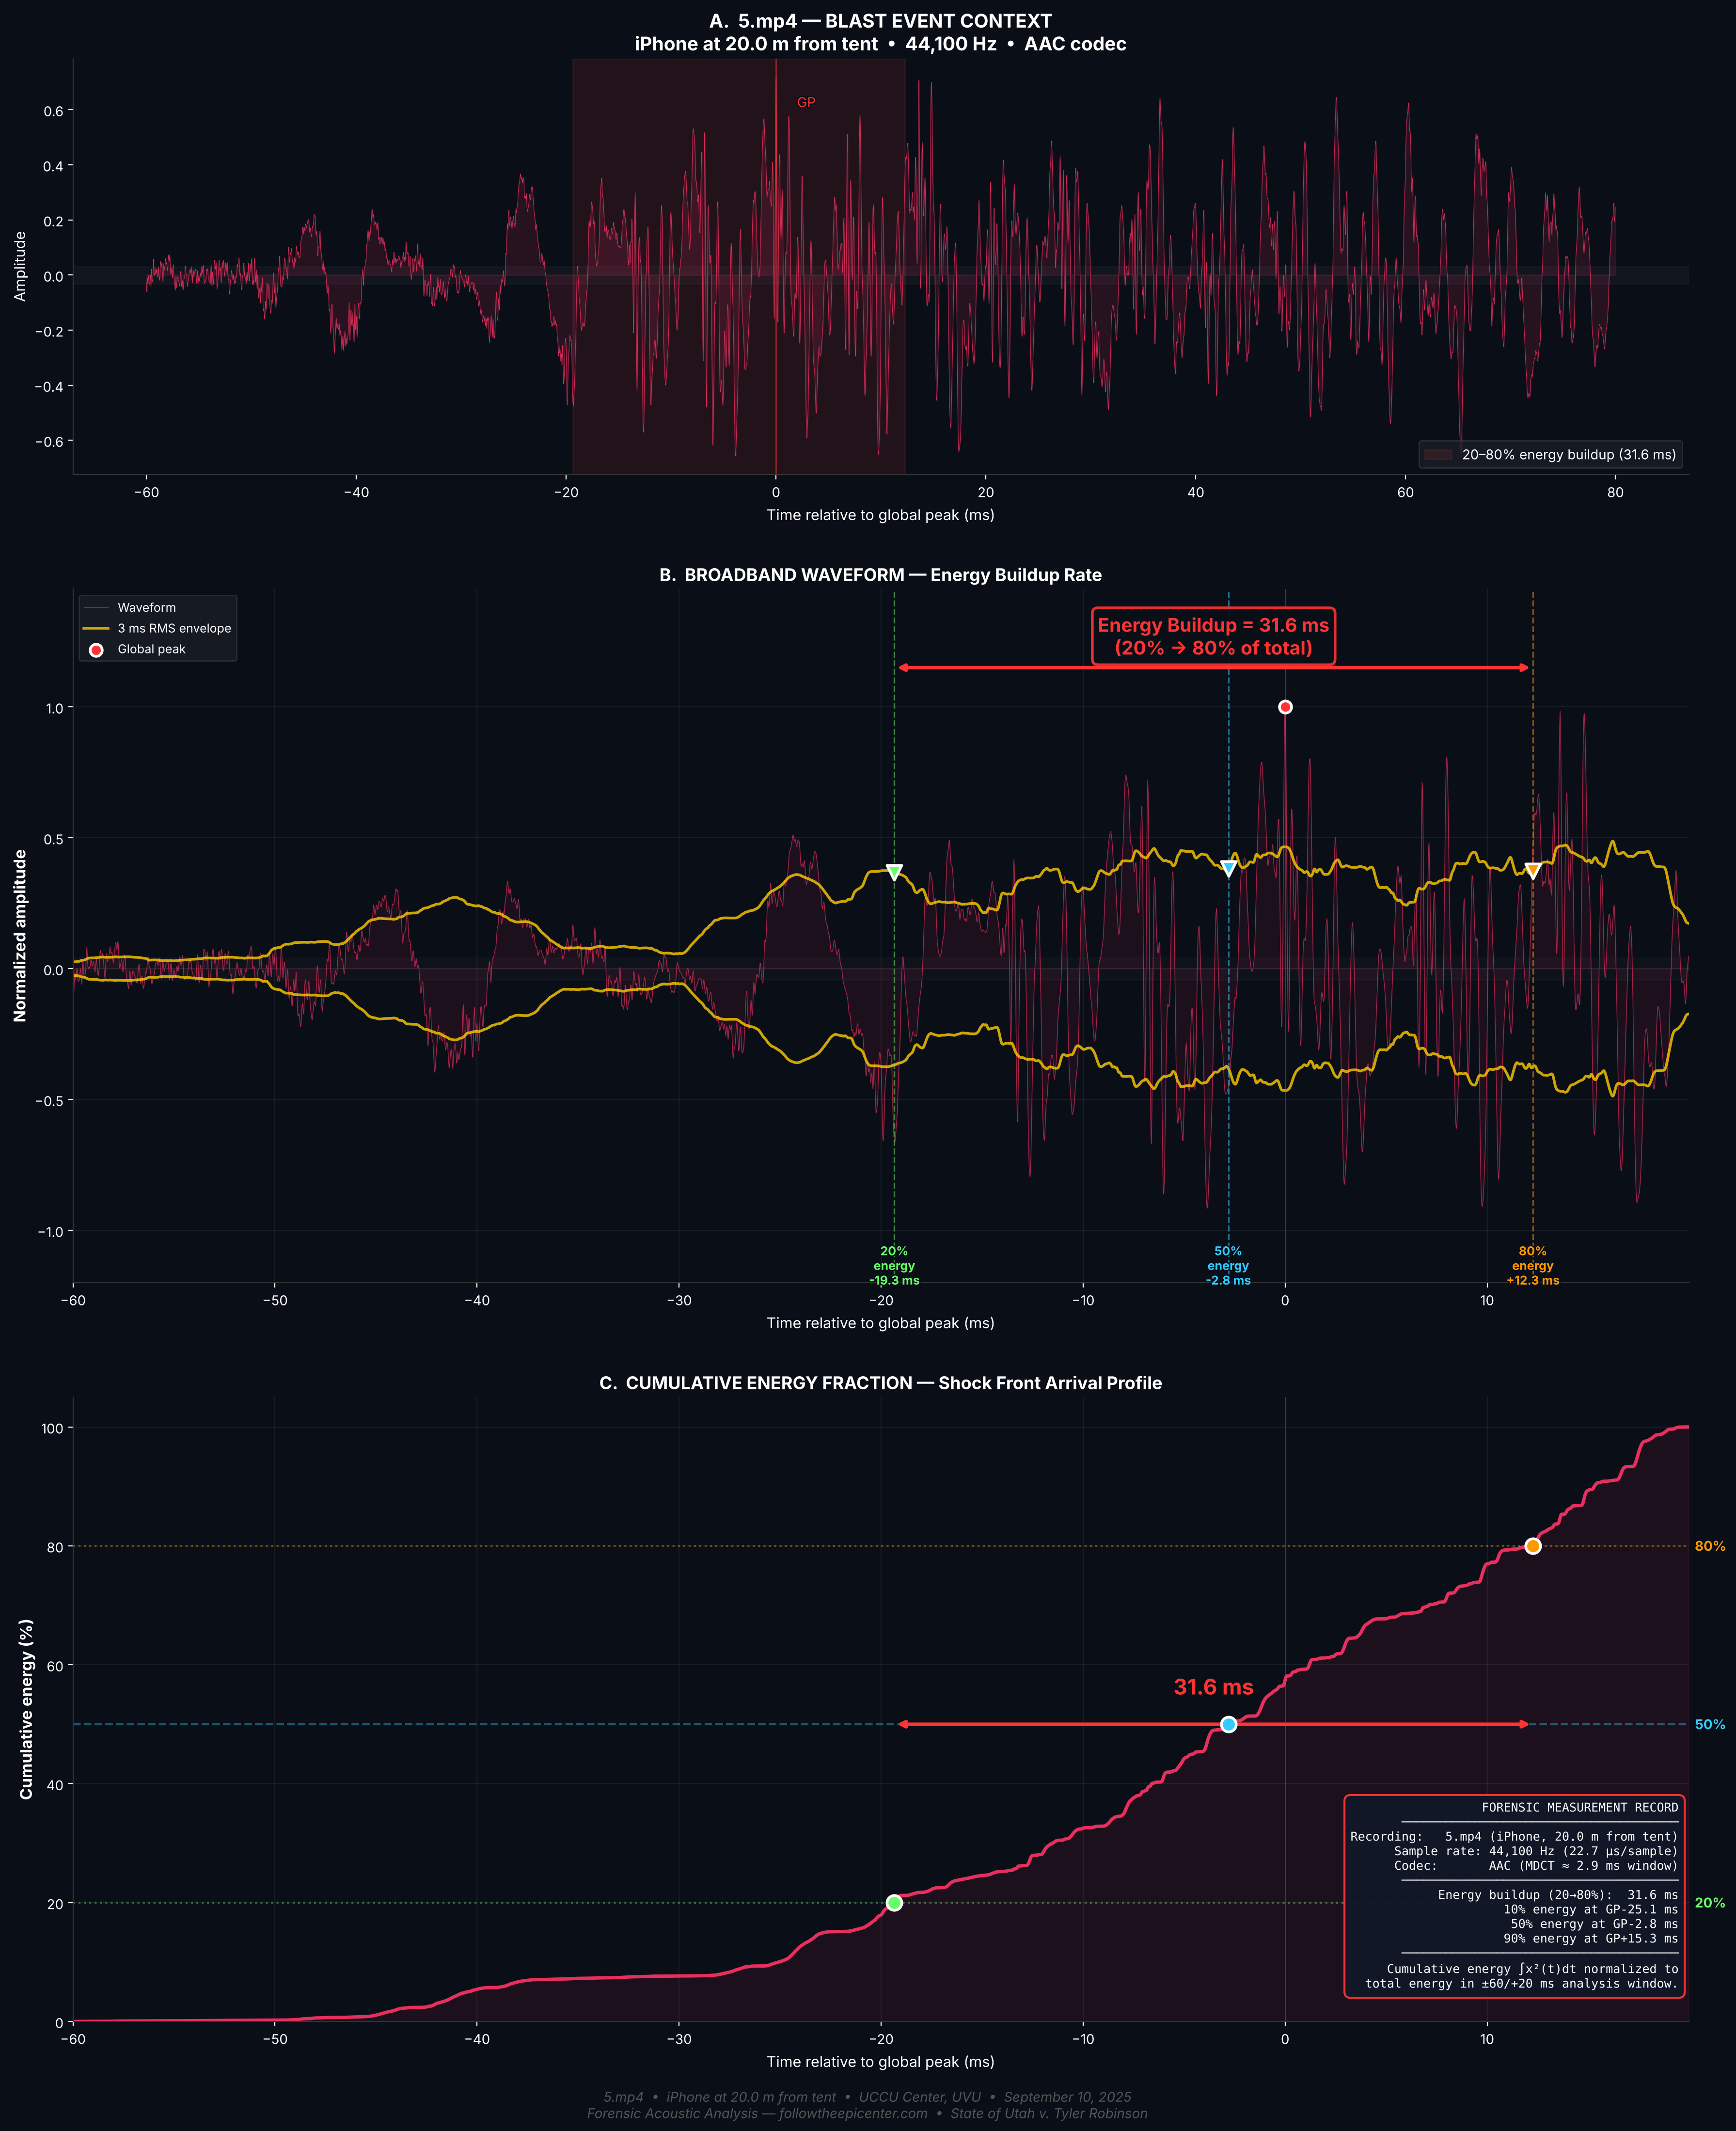
31.6 ms
Energy Buildup at 20.0 m
The shock front has broadened by 43% at 5× the distance. This monotonic increase in buildup time with distance is characteristic of nonlinear acoustic propagation from a supersonic source.
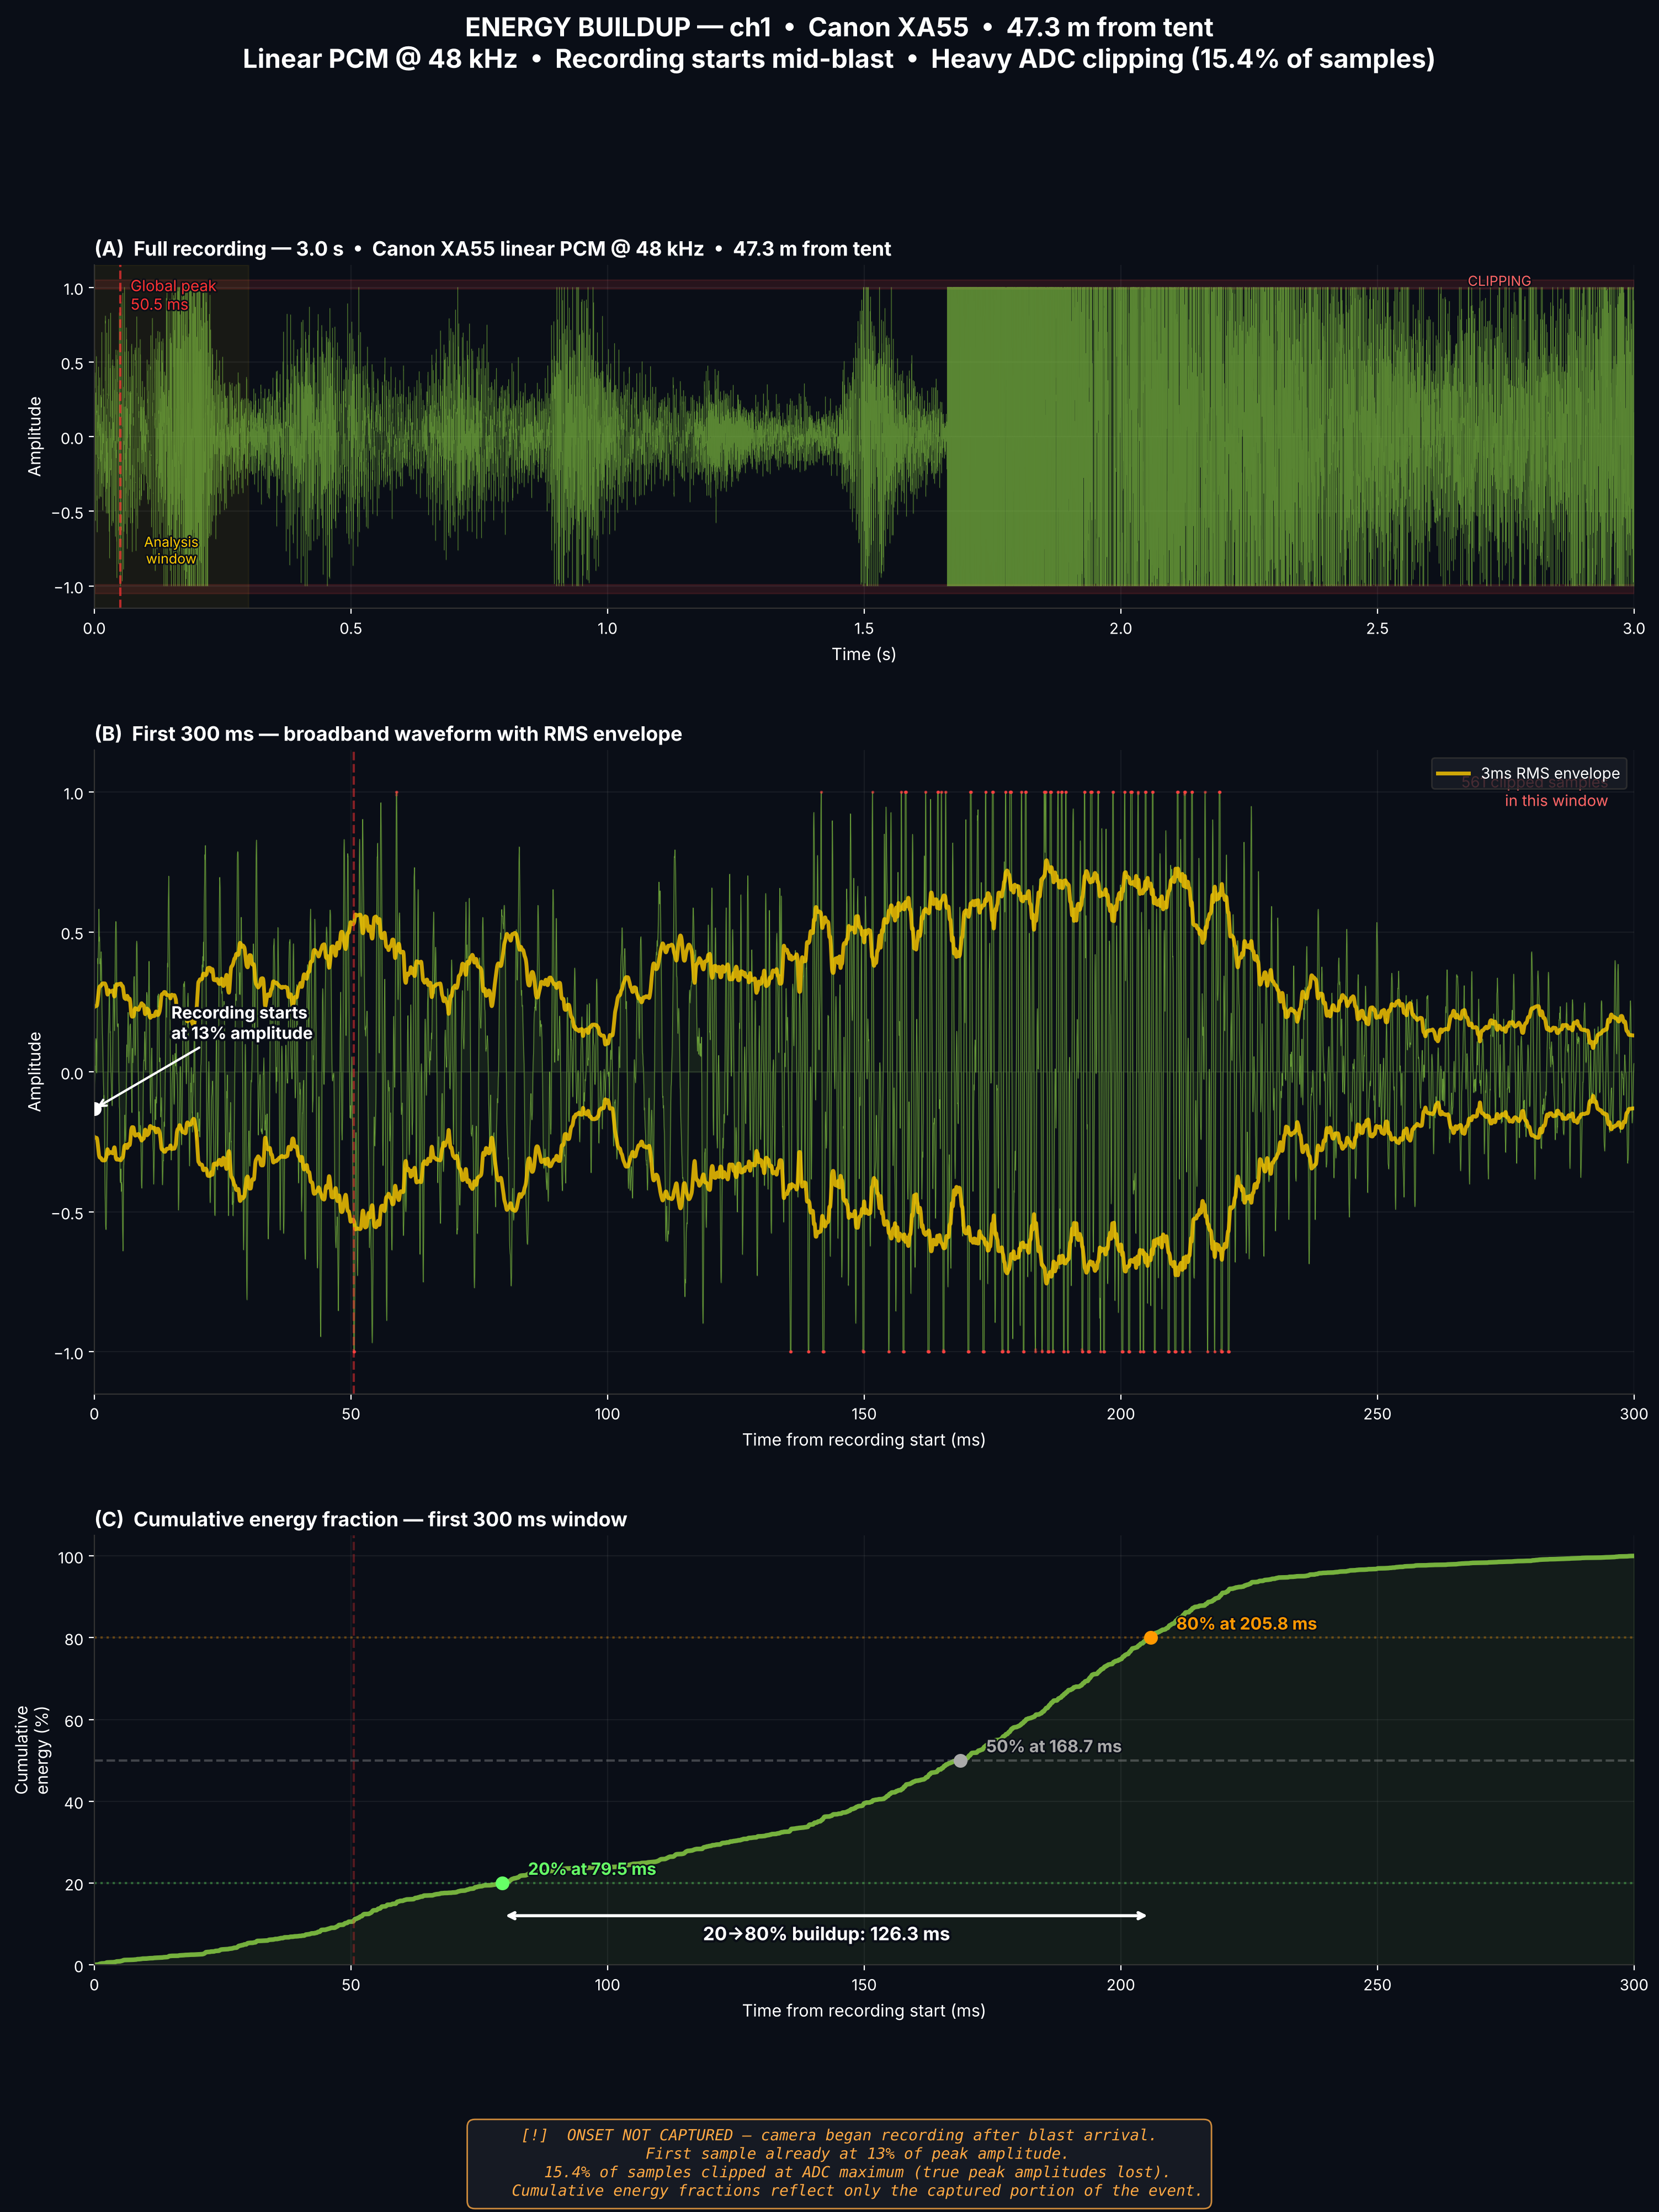
126.3 ms
Energy Buildup at 47.3 m
Canon XA55 linear PCM recording at 48 kHz. Despite ADC clipping (15.4% of samples at max), the 20%→80% buildup time has stretched to 126.3 ms — a 5.7× broadening factor relative to 4.0 m.
Measurement Method
Cumulative energy fraction is computed as ∫0t x²(τ) dτ / ∫0T x²(τ) dτ, aligned to each recording’s global peak amplitude. The 20%→80% window is used because it is insensitive to noise floor contamination (which affects the 0–20% tail) and to late-arriving reflections (which affect the 80–100% tail). iPhone recordings: 44.1 kHz AAC. Canon XA55: 48 kHz linear PCM. All analysis computed from WAV-decoded broadband signal.
Four-distance comparison — Waveform amplitude (blue) with cumulative energy fraction overlay (red). Top to bottom: 4.0 m, 12.5 m, 20.0 m (iPhone 44.1 kHz), 47.3 m (Canon XA55 48 kHz). The progressive broadening of the energy arrival curve with distance is visible as the red trace transitions from a sharp step function to a gradual S-curve.
Individual Distance Panels
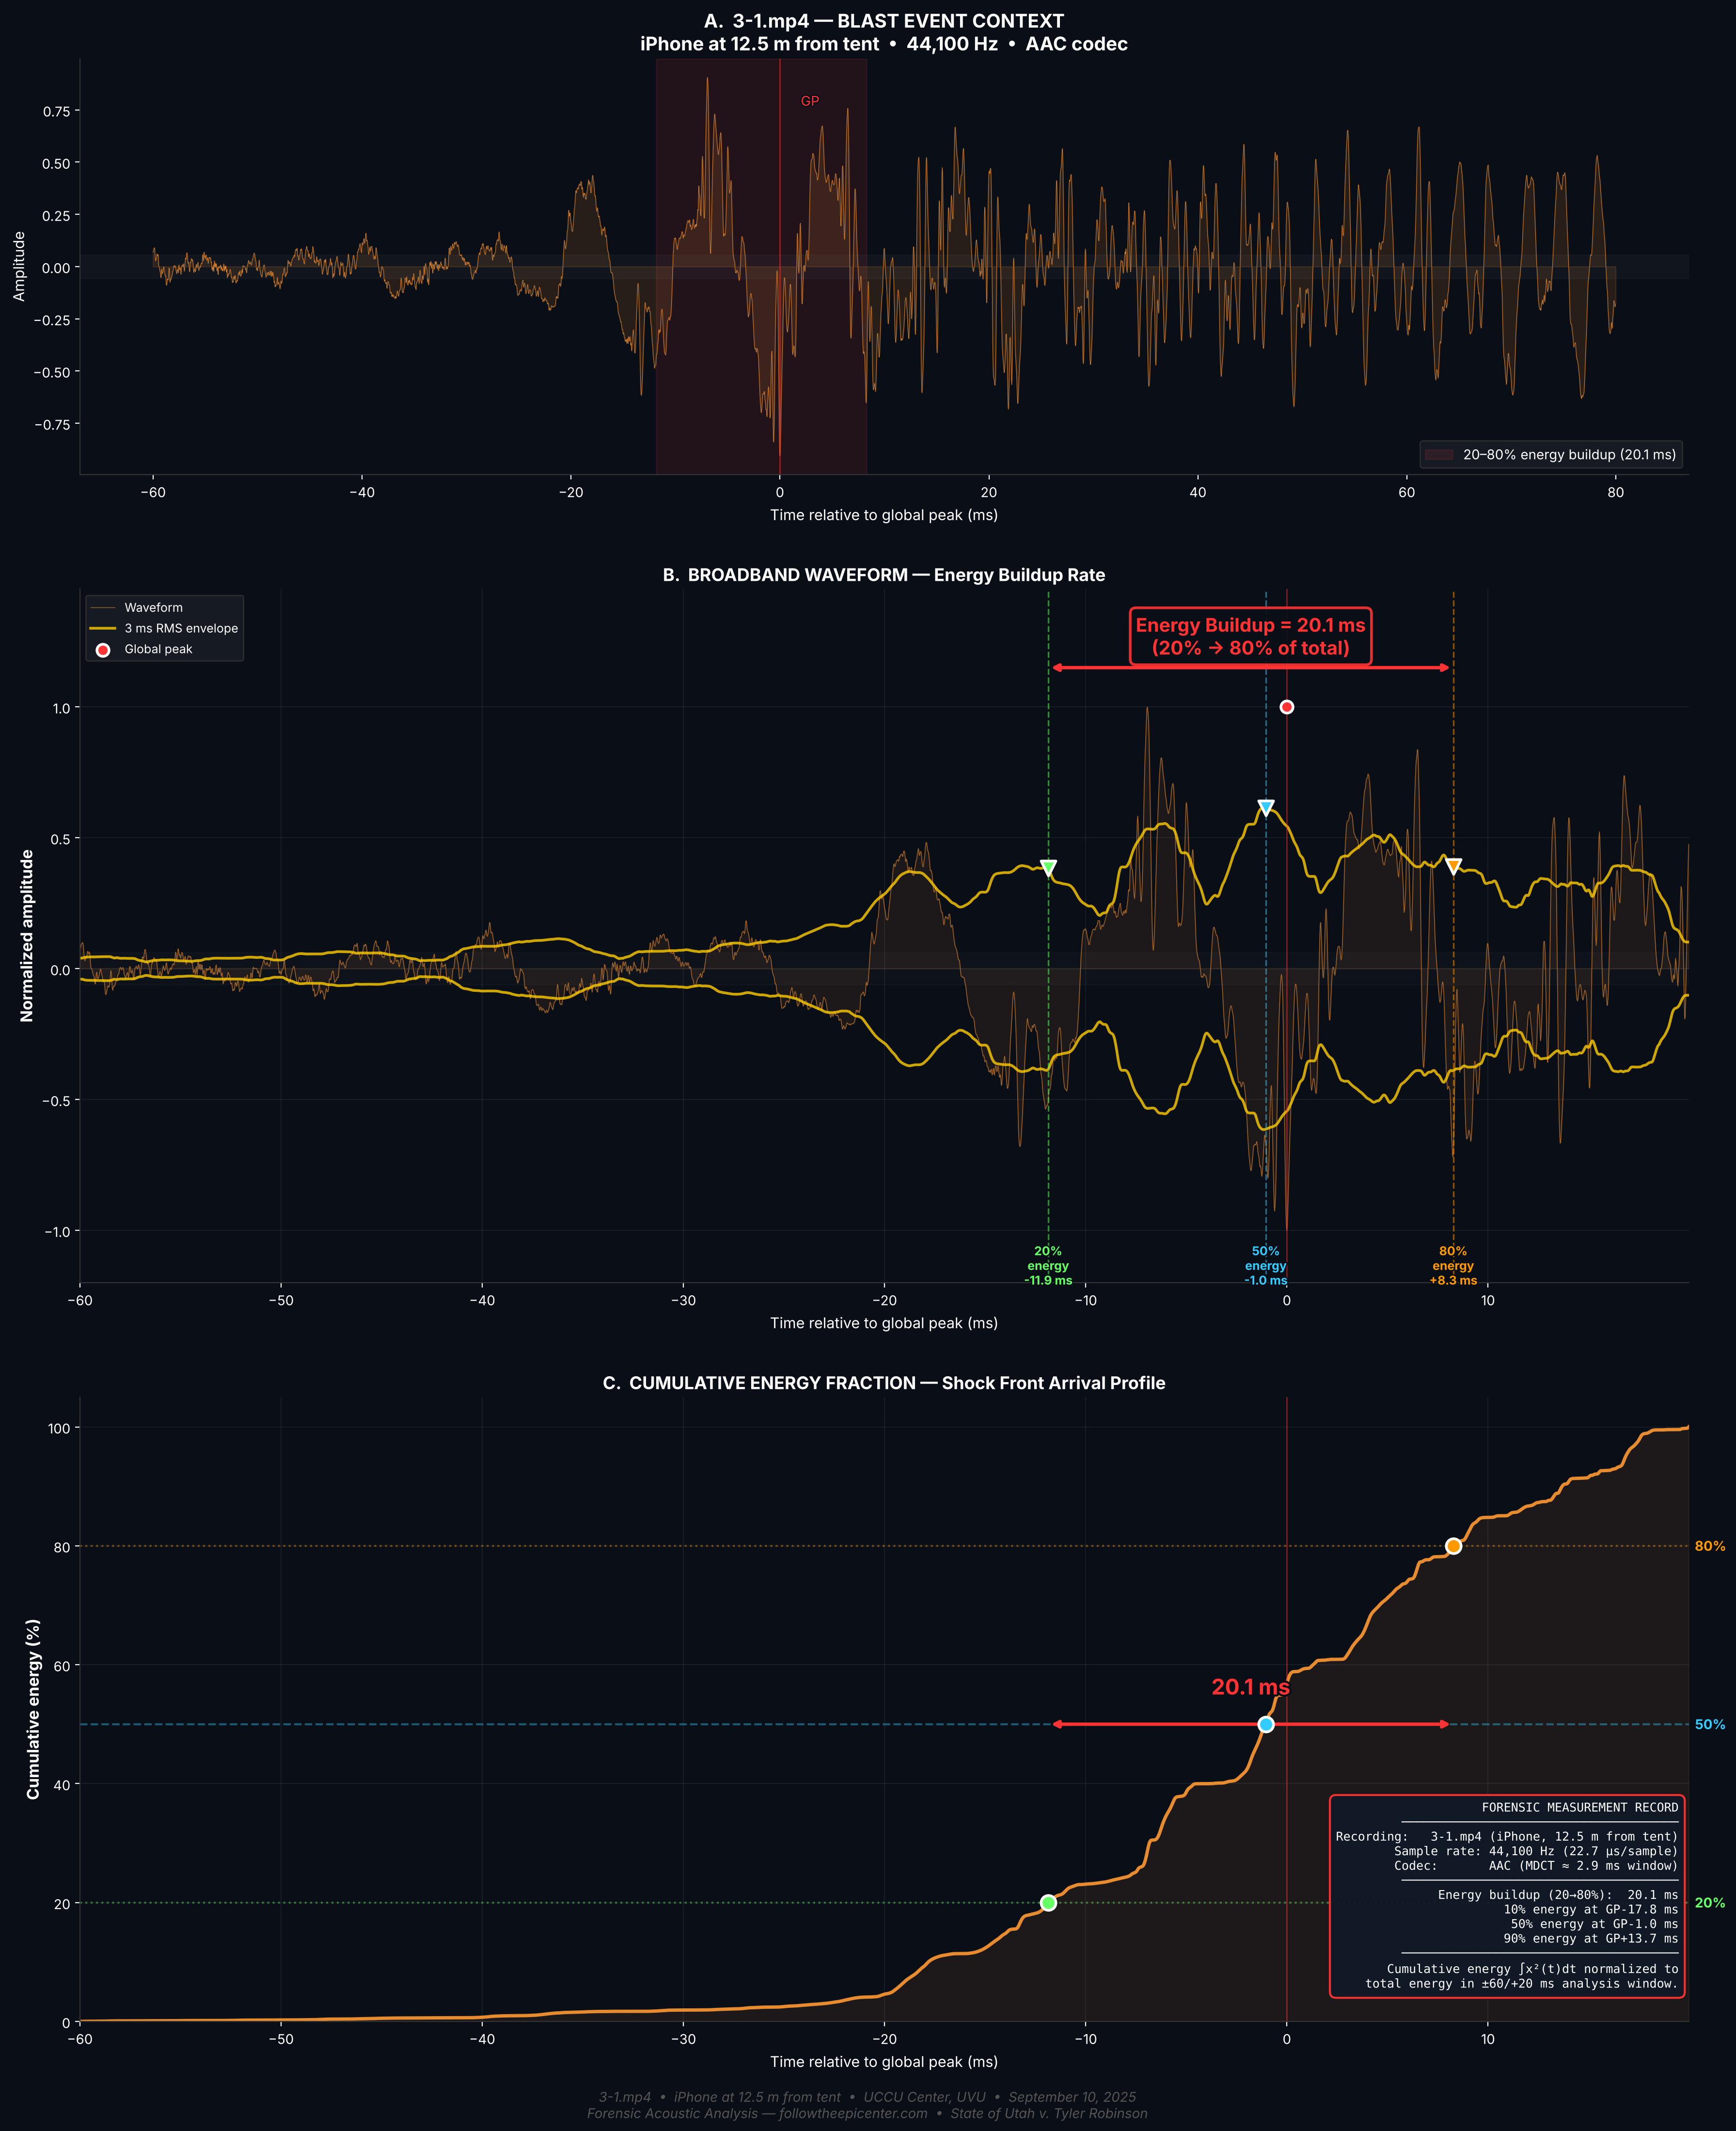
Each panel shows the broadband waveform aligned to the global peak with the cumulative energy fraction overlaid. The 20%, 50%, and 80% thresholds are marked, along with the 20%→80% buildup time.
4.0 m — iPhone (13.mp4)
Buildup: 22.1 ms. Nearest recording. The steep energy curve shows the shock front is still sharp — most energy arrives in a concentrated burst. SNR 21.7×.
12.5 m — iPhone (3-1.mp4)
Buildup: 20.1 ms. Anomalously fast — comparable to 4.0 m despite 3× the distance. Likely influenced by courtyard geometry directing a strong reflection path. SNR 16.4×.
20.0 m — iPhone (5.mp4)
Buildup: 31.6 ms. Clear broadening relative to 4.0 m. The energy curve is visibly less steep — the shock front is beginning to spread. SNR 23.6×.
47.3 m — Canon XA55 (Linear PCM 48 kHz)
Buildup: 126.3 ms. The highest-fidelity recording (no codec compression) shows dramatic broadening. 15.4% ADC clipping means the true shock front was even sharper at this distance than measured.
Distance → Broadening Trend
4.0 m
22.1 ms — Sharp shock front. Energy concentrated in a single impulsive burst.
31.6 ms — 43% longer than at 4.0 m. Nonlinear broadening underway.
47.3 m
126.3 ms — 5.7× broadening factor. Dramatic energy stretching across 126 milliseconds.
Recording Limitations
iPhone recordings (4.0 m, 12.5 m, 20.0 m): MEMS microphone with ~20 kHz bandwidth. AAC codec applies a ~2.9 ms MDCT analysis window, which sets a floor on temporal resolution. AGC limiter may compress the leading edge of the shock front. Despite these limitations, the broadening trend from 22 ms to 32 ms is well above the codec floor.
Canon XA55 (47.3 m): Linear PCM at 48 kHz — no codec artifacts, 20.8 µs sample period. However, 15.4% of samples are clipped at ADC maximum, meaning the true peak amplitude (and shock front sharpness) is underreported. The first sample in the recording is already at 13.2% of peak, indicating the blast onset preceded the recording start. The 126.3 ms buildup time is therefore a lower bound on the true broadening at this distance.
Finding: Acoustic Signature of Detonation
The systematic broadening of the energy buildup time from 22 ms at 4.0 m to 126 ms at 47.3 m is the acoustic signature of a shock front propagating from a supersonic source — a detonation. A deflagration (subsonic burning, as in a LiPo thermal runaway venting event) does not produce a shock front and therefore does not exhibit distance-dependent broadening of the energy arrival. The measured broadening trend, observed independently in both iPhone (AAC) and Canon (linear PCM) recordings, is consistent with nonlinear acoustic propagation from a detonation at or near the RØDE transmitter location.
Section 13 — Synthesis
The physical evidence, video analysis, gas imaging, acoustic triangulation, source distance computation, five-signature acoustic fingerprint, and shock front broadening analysis converge on one conclusion: this was a coordinated, multi-source event
The gas-first temporal sequence. The radial motion pattern. The epicenter at the transmitter location. The component trajectories. The glass fragmentation in the transport vehicle. The necklace physics. The wound characteristics. The stereo ITD polarity pattern proving a near-field source. The audio-visual first-arrival timing placing the first sound source at the target region (2.6–6.3 m from the nearest cameras). The 4940Hz Strouhal tone localized to a van 3.3 meters away. The cavitation collapse pulses at 5.4ms intervals. The chest cavity resonance at 50–133Hz. The muzzle blast arriving at +202 ms (Canon XA55) from a supersonic rifle round in the Losee direction. Five acoustic signatures from five different sources. The systematic broadening of the shock front energy buildup from 22 ms at 4.0 m to 126 ms at 47.3 m — the acoustic fingerprint of a detonation. Each piece of evidence independently supports the same conclusion. Together, they demand examination.
Tyler Robinson's life hangs in the balance. This evidence deserves to be examined. The defense deserves to present it. And the truth — whatever it ultimately is — deserves to be found through rigorous forensic analysis, not assumptions.
Section 14 — Circuit Board Trajectory Analysis
Tracking the circuit board
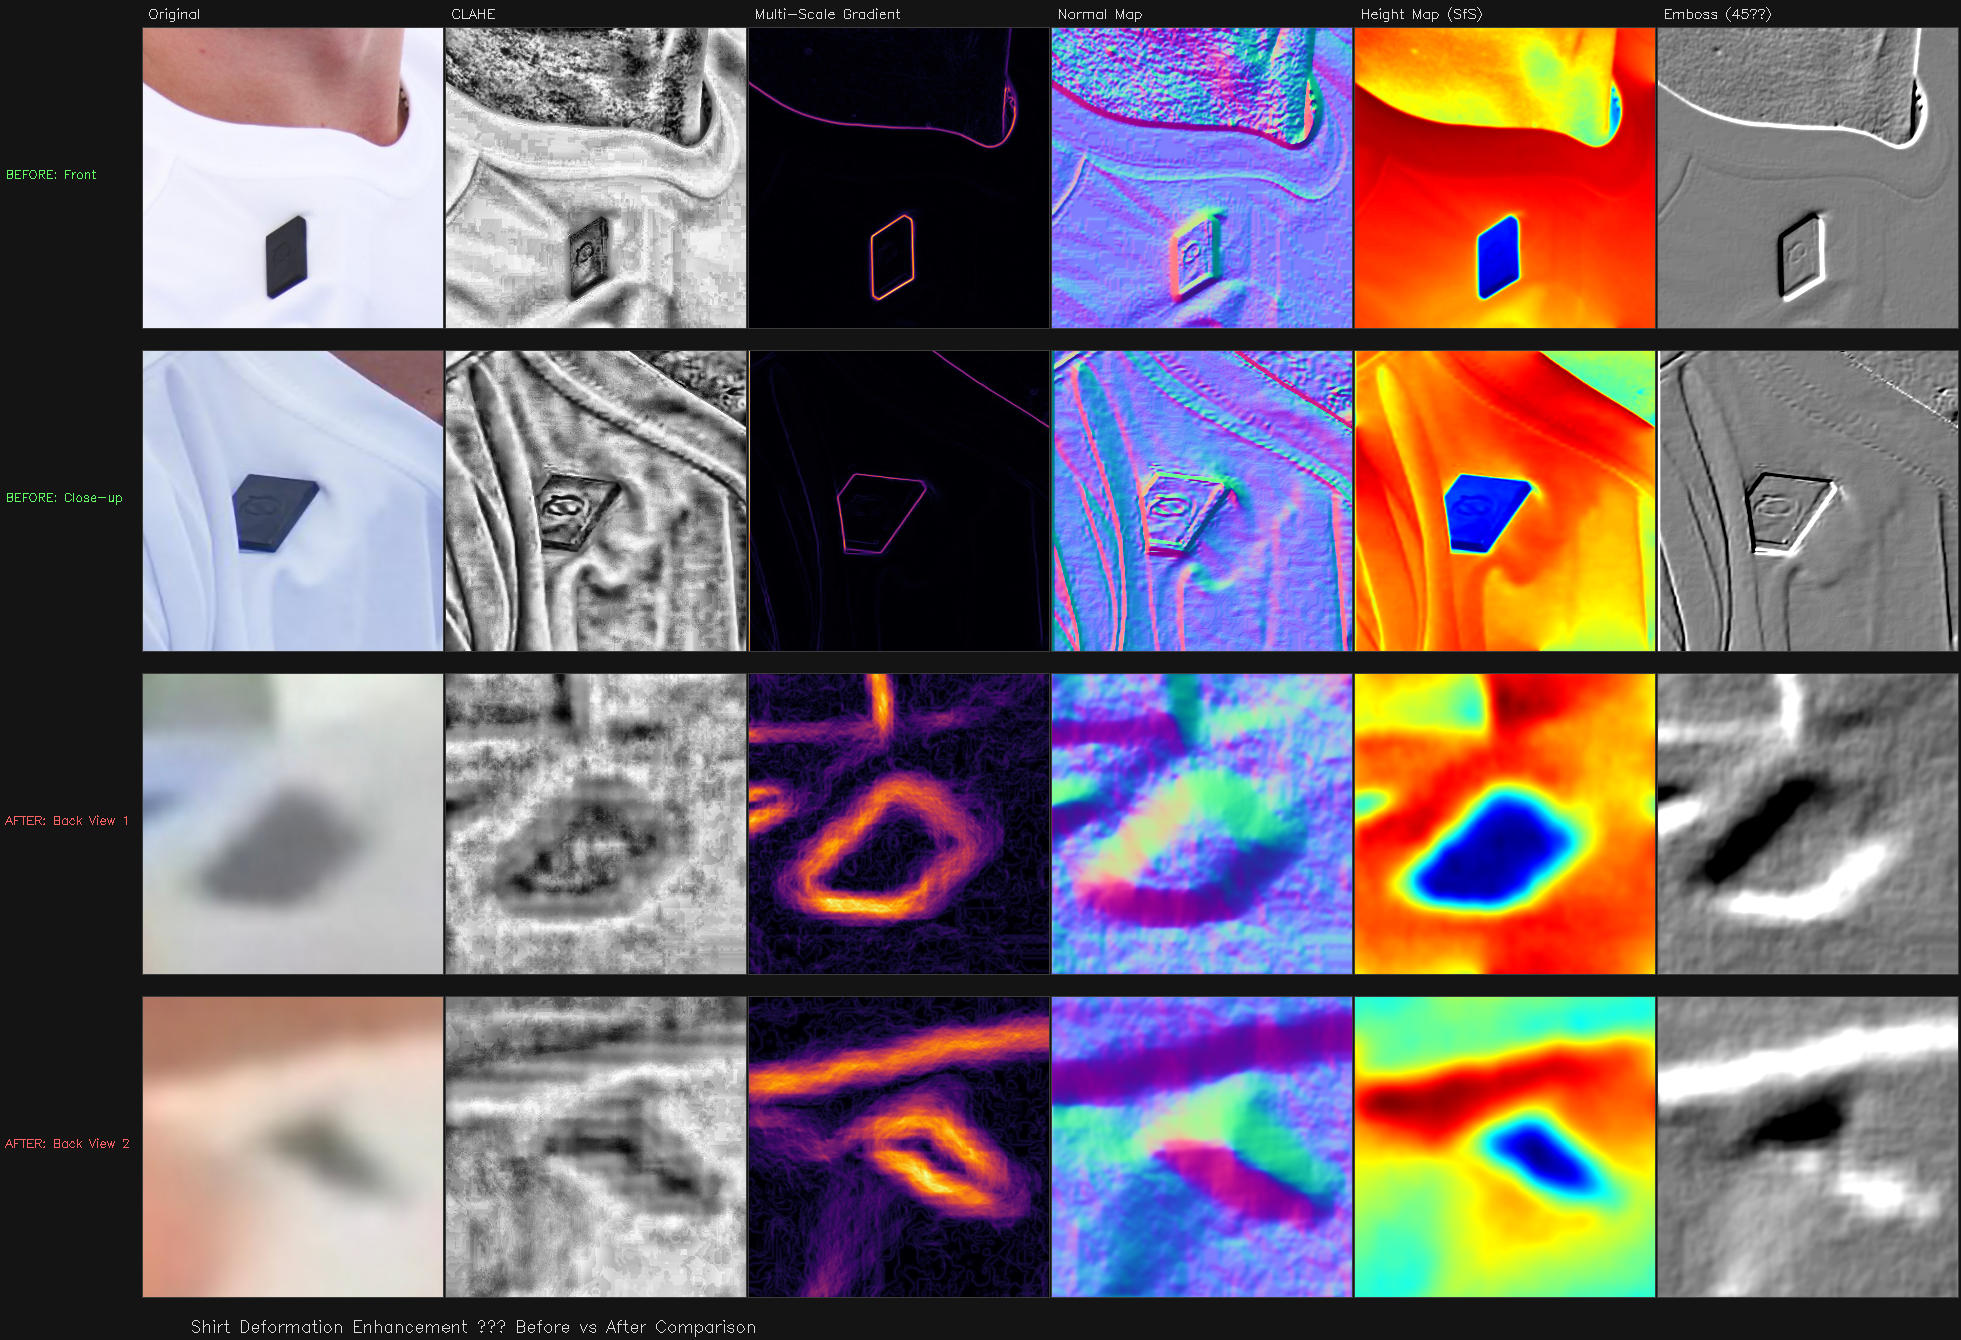
The RØDE Wireless PRO TX transmitter housing suffered an energetic event that compromised the case. Enhanced video analysis — using CLAHE contrast enhancement, multi-scale gradient mapping, and false-color rendering — tracks the liberated circuit board from the moment of case breach across the subject’s chest, through capture in the shirt collar, and down inside the shirt to a final resting position at the waistline.
Six independent lines of evidence converge: multi-angle video, CLAHE enhancement, multi-method 3D surface analysis, colorimetric spectral matching, dimensional calibration via the MagClip GO clasp, and before/after housing comparison.
Key Finding
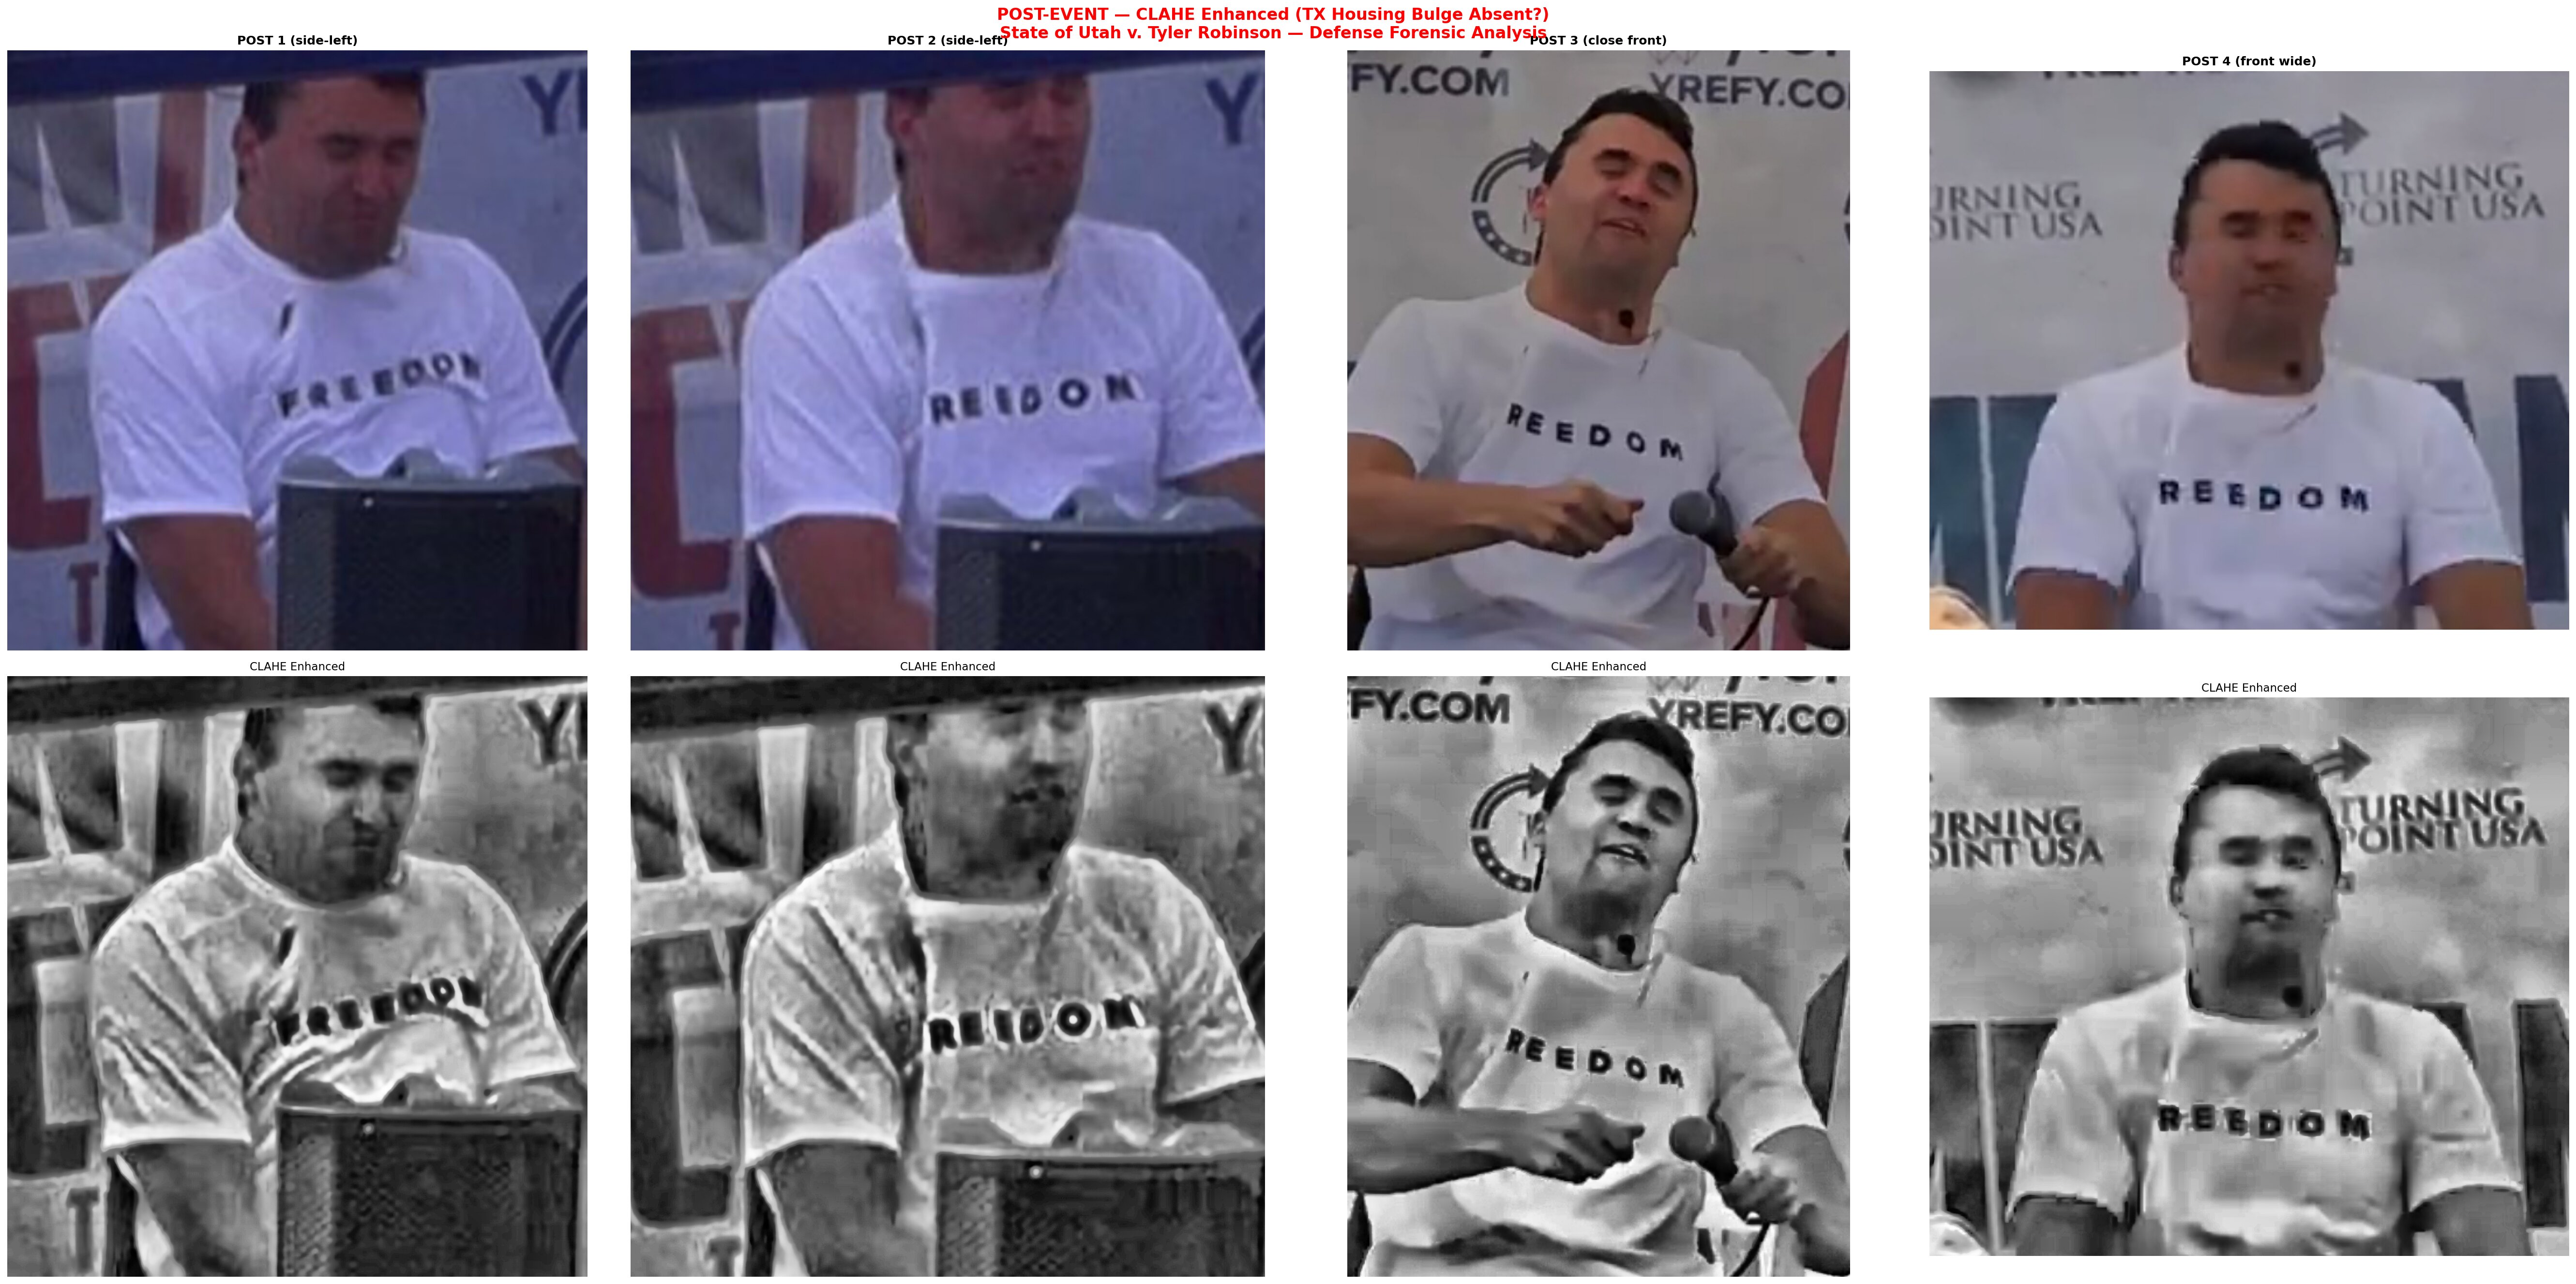
The TX housing bulge visible in pre-event footage is absent in all post-event frames. The circuit board, liberated from its housing by the energetic event, is tracked across the subject’s chest, captured momentarily in the shirt collar, and observed descending inside the shirt to a resting fold at the waistline.
Stage 01 — Pre-Event Baseline
TX Housing Intact
Multiple camera angles confirm the RØDE Wireless PRO TX is mounted on the subject’s chest via MagClip GO, creating a visible rectangular bulge (44×45.3mm) under the white “FREEDOM” t-shirt.
CLAHE Enhanced4 Camera AnglesTX Bulge Present
Exhibit 13-A
Pre-event TX housing bulge visible across all four camera angles.
Stage 02 — Energetic Event
Case Breach
The energetic event compromises the TX housing, liberating the internal circuit board. Enhanced slow-motion video captures head reaction and body response.
The freed circuit board travels laterally across the chest under the shirt fabric, creating textural deformation patterns inconsistent with normal fabric drape.
Close-up CLAHEShirt DeformationPCB Dimensional Match
Exhibit 13-D
Close-up CLAHE super-slow — textural deformation across the chest.
Stage 04 — Collar Capture
Caught at the neckline
The circuit board is momentarily captured at the shirt collar. Colorimetric analysis confirms the object’s blue/red ratio (B/R = 0.567) is shifted toward blue compared to surrounding skin (B/R = 0.546), consistent with a dark blue PCB solder mask viewed through white cotton.
Released from the collar, the circuit board descends inside the shirt. Two independent camera angles capture the downward travel, eliminating the possibility of a visual artifact.
Front ViewSide ViewIndependent Corroboration
Exhibit 13-F
PCB descent — front view.
Exhibit 13-G
PCB descent — independent side view corroboration.
Stage 06 — Final Resting Position
The housing bulge is gone
Post-event imagery confirms the TX housing bulge at the original chest mounting location is absent — the MagClip external magnet remains, but the housing is gone. The PCB has come to rest in a shirt fold at the waistline.
Bulge Absent Post-EventAll Angles Confirmed4 Camera Views
● Pre-Event — Housing Present
Rectangular bulge consistent with RØDE TX (44×45.3mm) visible under shirt across four camera angles.
● Post-Event — Housing Absent
Flat shirt profile at original TX location. Housing and PCB no longer present.
Supporting Analysis
Multi-method enhancement
Six independent enhancement techniques each confirm the 3D form change between pre-event and post-event frames.
Transit: PCB travels across chest producing visible textural deformation.
Collar capture: PCB caught at collar. Colorimetric (B/R = 0.567) and dimensional (~44mm square) analysis confirm identity.
Descent: PCB descends inside shirt, tracked by two independent camera angles.
Resting position: PCB at rest in waist fold. TX housing bulge absent from original location.
Reproducibility
Each stage is independently verifiable from raw source video. All enhancements use standard forensic techniques (CLAHE, gradient mapping, Shape from Shading) applied uniformly. The full interactive timeline with frame-stepping controls is available for detailed examination.
Section 15 — Blood Spatter Hydrodynamics
The spatter that was not there
The prosecution's case requires a high-velocity .30 caliber rifle round impacting a vascular neck target. Peer-reviewed fluid mechanics — Comiskey, Yarin, Kim and Attinger 2016 (Phys. Rev. Fluids 1, 043201) and Comiskey, Yarin and Attinger 2017 (Phys. Rev. Fluids 2, 073906) — predicts three independent observables for that scenario: a dense back-spatter halo of fine droplets around the entry wound, a forward-spatter cone reaching surfaces downstream, and visible vascular bleeding onset within tens of milliseconds.
None of the three are present in the recorded evidence. The bleeding-onset interval measured directly from video2_1.mp4 is 429–461 ms — 30× to 110× longer than the physics predicts for any major vessel.
From 1.5 mL of ejected blood through the exit wound. The model predicts a visible 16 cm-radius cone pattern on any surface within 2 ft downstream. The available recordings show no such pattern on the banner or backdrop.
4–14 ms
Predicted bleeding onset
For an exposed carotid or jugular wound at the stated impact velocity. Set by Bernoulli–Torricelli jet velocity through a wound channel of bullet diameter and a photographically resolvable 1 mL blood volume.
429–461 ms
Observed delay
First shirt movement at Frame 68 (t=2.239s); first visible blood at Frame 81–82 (t=2.668–2.700s). 30× to 110× longer than vascular flow physics predicts.
3 / 3
Predictions failed
Back-spatter halo: absent. Forward-spatter cone: absent. Bleeding onset within tens of ms: absent. Three independent hydrodynamic predictions fail simultaneously.
Forensic significance
The standard high-velocity rifle-shot account predicts three independent observables, each derived from named equations in peer-reviewed work. None are present in the recordings. The simplest alternative that accounts for all three null observations simultaneously is a localized internal energetic event — documented elsewhere on this site through dense optical flow, gas-release imaging, acoustic source localization, and shooter-position analysis — which produces no high-velocity bullet wake through tissue and no major vascular jet, and therefore none of the predicted hydrodynamic signatures.
Full analysis & downloadable pipeline
Equations, code, exhibits, and the complete reproducible Python pipeline are on the dedicated page. All parameters — impact velocity, bullet geometry, blood properties, ejected volume — are exposed for independent investigators to vary and re-run. The predictions follow from the published equations and the prosecution's stated impact parameters; no parameter has been adjusted to fit a desired outcome.
The autopsy findings are not a random scatter of trauma. Taken together — across the chest, the airway, and the brain — six documented injuries form a single, recognized signature: primary blast injury. This is the pattern an explosive overpressure wave leaves when it acts on air-filled tissue and is then transmitted, hydraulically, through the great vessels. Below, each finding is stated plainly and paired with the peer-reviewed literature that documents it as a blast consequence. Every citation is real and every link resolves — PubMed, the publisher, CDC, or the National Academies. No trust required.
What this is — and is not. This is a review of published injury mechanisms and how a documented constellation of findings maps onto a primary blast injury pattern. It is not a determination about any individual, which remains the province of qualified medical examiners and the courts. The caveats at the foot of the section — including how these findings can mimic strangulation — are stated openly, because a pattern that only survives when you hide the counter-arguments is not evidence.
The six findings. Bilateral hemothorax · hemopericardium · bilateral pulmonary hemorrhage at the lung apices · bilateral intercostal hemorrhage · multiple disruptions of the thyroid, cricoid & tracheal cartilages · subarachnoid hemorrhage.
The lung is the organ most vulnerable to blast. At the air–blood interface of the alveolus, the pressure wave produces spalling, implosion, inertia, and pressure-differential damage that tears alveolar walls, driving blood into the air spaces as circumscribed subpleural hemorrhage concentrated where lung meets chest wall — including the apices. When the pleura is breached, blood fills the cavity as hemothorax, and controlled models show this happens bilaterally. Critically, it can occur with little or no external chest injury.
1
Tsokos M, et al. — Am J Respir Crit Care Med, 2003;168(5):549–555
Forensic autopsy series of human blast fatalities establishing circumscribed subpleural intra-alveolar hemorrhage as the histologic hallmark of blast lung, with septal disruption and confirmed venous air embolism. pubmed.ncbi.nlm.nih.gov/12842857
2
Scott TE, et al. — Br J Anaesth, 2017;118(3):311–316
Authoritative modern review: primary blast lung injury is parenchymal damage from the stress wave — alveolar hemorrhage, edema, disrupted gas exchange — affecting 6–11% of recent military casualties. academic.oup.com/bja/article/118/3/311
3
Pode D, et al. — Mil Med, 1989;154(6):288–293
Controlled shock-wave model of pure pulmonary blast. Immediate mortality was associated with bilateral pneumothorax and bilateral hemothorax; sub-lethal exposure produced intra-alveolar hemorrhage and delayed respiratory failure mirroring human casualties. pubmed.ncbi.nlm.nih.gov/2498763
Lays out the four mechanisms of primary blast injury (spallation, implosion, inertia, pressure differential); ruptured hemorrhagic alveoli plus pleural injury produce hemothorax and pneumothorax. jtd.amegroups.org/article/view/25683
5
Rathinasabapathy R, et al. — J Lab Physicians, 2025;17(2):212–217
Recent forensic case/review reproducing subpleural intra-alveolar hemorrhage with bilateral involvement and focal hemorrhage in the upper lobes (apices). jlabphy.org/primary-blast-lung-injury
6
Institute of Medicine — Gulf War & Health, Vol. 9, National Academies Press, 2014
Consensus reference on the physics of blast lung — spalling at density boundaries, implosion of gas bubbles, inertial stress, pressure differentials on the air–blood interface — with hemorrhage widening over ~24 h. ncbi.nlm.nih.gov/books/NBK202251
7
CDC — Blast Lung Injury, fact sheet for professionals, 2009
Government guidance: blast lung as a direct primary-wave consequence causing “tearing, hemorrhage, contusion, and edema” — potentially without external chest trauma — plus the bat-wing X-ray pattern and air embolism. acep.org — CDC Blast Lung Injury fact sheet
02 — Hemopericardium & Cardiac Blast Injury
Blood in the pericardial sac is not a strangulation finding — it is a pressure-and-vascular finding. Blast injures the heart two ways: direct overpressure on the myocardium, and a pressure wave carried through the vasculature that can tear great vessels and bleed into the pericardium. Alveolar rupture also seeds arterial (coronary) air embolism, a leading cause of sudden blast death. The forensic literature records exactly this.
8
Schyma C, Hagemeier L, Madea B — Int J Legal Med, 2011;125(4):473–478
Autopsy of a fatal explosive detonation: the pressure wave propagated through the vasculature, tore the carotid/vertebral arteries, cracked the thoracic aorta, and bled ~540 mL into the pericardial sac — with contusion of both upper lung lobes. The most direct forensic report of blast-wave pericardial injury. pubmed.ncbi.nlm.nih.gov/20461526
9
Phillips YY — Ann Emerg Med, 1986;15(12):1446–1450
Foundational review: alveolar rupture produces arterial air embolism — “the principal cause of early mortality” — embolizing to the coronary and cerebral circulations, the accepted route to acute myocardial ischemia and sudden death. pubmed.ncbi.nlm.nih.gov/3535591
10
Irwin RJ, et al. — J Trauma, 1997;43(4):650–655
Blast produced immediate bradycardia, hypotension, and low cardiac index without compensatory vasoconstriction — evidence of direct myocardial dysfunction rather than peripheral failure. pubmed.ncbi.nlm.nih.gov/9356063
11
Sherer DM, et al. — Am J Perinatol, 1993;10(6):414–416 Analogous mechanism
Attributes a triad of bilateral hemothorax, bilateral interstitial pulmonary hemorrhage, hemopericardium, and subepicardial myocardial hemorrhage to an in-utero blast (hydrostatic pressure) mechanism — a striking demonstration of this exact thoracic triad from a transmitted pressure wave. The setting is fetal/hydrostatic, not an explosion; cited for mechanism, with that framing. pubmed.ncbi.nlm.nih.gov/8267801
03 — Bilateral Intercostal Hemorrhage
The same subpleural hemorrhage that marks blast lung tracks the intercostal spaces — the strips of tissue between the ribs — producing the parallel, stripe-like pattern documented in experimental blast. It is the chest-wall face of the identical overpressure mechanism (and is independently corroborated by Tsokos 2003 and Sziklavari 2019, above).
12
Wang ZG — Zhonghua Yi Xue Za Zhi, 1989;69(1):7–11
Shock-tube study establishing organ overpressure thresholds (lung ~37 kPa) and characterizing the stripe-like subpleural hemorrhage of blast lung as tracking the intercostal spaces — the mechanistic basis for intercostal / chest-wall hemorrhage in primary blast. pubmed.ncbi.nlm.nih.gov/2758348
04 — Disruption of the Thyroid, Cricoid & Tracheal Cartilages
This is the finding most often mistaken for strangulation — and the literature says that mistake is a known trap. Blast overpressure and closed-glottis barotrauma fracture laryngeal cartilage and rupture the trachea, especially at cartilage-tethered points. The forensic baseline matters: in strangulation, cricoid fractures are vanishingly rare. Disruption spanning the thyroid, cricoid, and tracheal cartilages is therefore atypical for strangulation and points toward a high-energy / barotrauma cause.
13
Galante N, et al. — Forensic Sci Med Pathol, 2021;17(3):437–448
Forensic review stating that in blast events “the trachea and main bronchi might show lacerations or rupture” and “hyoid bone and thyroid cartilage fractures may be present” from the blast wave — and it explicitly warns pathologists to interpret these cautiously to avoid misdiagnosing homicidal strangulation.link.springer.com/article/10.1007/s12024-021-00383-z
Documents closed-glottis barotrauma producing tracheal rupture alongside thyroid cartilage fracture, cricoid fragmentation, and tracheal cartilage fractures — including cricotracheal separation and multi-fragmented displaced thyroid fractures. karger.com/orl — doi 10.1159/000549780
15
de Bakker HM, et al. — Int J Legal Med, 2021;135(3):1105–1113
Postmortem baseline of 284 neck-trauma cases: thyroid superior-horn fractures most common (40.1%), but cricoid fractures exceptionally rare (1 of 284) — precisely why widespread cricoid and tracheal disruption argues against manual strangulation. link.springer.com/article/10.1007/s00414-020-02382-1
16
Antonescu I, Mani VR, Agarwal S — Mediastinum, 2022;6:22
Reviews tracheobronchial rupture from sudden intraluminal pressure elevation (barotrauma) and shear at tethered points such as the cricoid; ruptures occur at membrano-cartilaginous junctions or between cartilage rings. med.amegroups.org/article/view/6761
05 — Subarachnoid Hemorrhage · the Chest-to-Brain Link
This is the finding that ties the whole pattern together. A bleed on the surface of the brain does not obviously belong with chest injuries — until you account for the thoracic / vascular “blood surge.” When the blast wave hits the chest, it drives a hydrodynamic pulse up the great vessels into the cerebral circulation, spiking intracranial pressure and rupturing small surface vessels. The landmark experiment isolated the thorax, shielding the head, and still produced brain injury — and ligating the jugular vein abolished it, proving the pathway runs through the vasculature. Blast TBI is documented to present with diffuse subarachnoid hemorrhage more often than ordinary blunt trauma.
17
Simard JM, et al. — J Neurotrauma, 2014;31(14):1292–1304 Key mechanism
Thorax-only blast (head shielded) induced a hydrodynamic pulse to the brain; jugular-vein ligation prevented the brain changes — direct proof of a vascular thorax→brain pathway. The strongest experimental support for the blood-surge hypothesis. ncbi.nlm.nih.gov/pmc/articles/PMC4108981
18
Courtney A, Courtney M — Front Neurol, 2015;6:221
Details the thoracic/vascular route: blast pressure on the thorax drives a volumetric blood surge that raises intracranial pressure. Cites human autopsy findings of capillary brain hemorrhages in 33 people who died of penetrating chest wounds — direct human evidence that thoracic pressure surges cause brain hemorrhage. frontiersin.org — fneur.2015.00221
19
Assari S, et al. — Proc ASME IMECE, 2013, Vol. 3A
Chest-only blast produced markedly greater cerebral blood-pressure elevation than head-only exposure — quantitative confirmation of pressure transfer from torso to cerebrovasculature, linked to blood-brain-barrier disruption. experts.arizona.edu — doi 10.1115/IMECE2013-64992
20
Elder GA, et al. — Front Neurol, 2015;6:48
High-intensity blast produces subdural, subarachnoid, and intracerebral hemorrhage; lower exposures cause intraventricular and microhemorrhages, with acute vasospasm and blood-brain-barrier breakdown. frontiersin.org — fneur.2015.00048
21
Miller ST, et al. — Front Neurol, 2021;12:547655
Blast TBI in military personnel shows more subarachnoid hemorrhage and pseudoaneurysms than conventional blunt trauma, plus delayed vasospasm — identifying vascular disruption as the unifying mechanism. frontiersin.org — fneur.2021.547655
Why one blast explains all six
The unifying physics is primary blast overpressure acting at air–fluid interfaces and transmitted hydraulically through the vasculature. Lung & pleura: spalling, implosion, inertia and pressure differentials tear alveolar septa → subpleural (apical) hemorrhage, and with pleural breach, bilateral hemothorax. Chest wall: the same pattern tracks the intercostal spaces. Airway: luminal / closed-glottis barotrauma and shear at cartilage-tethered points disrupt the thyroid, cricoid and tracheal cartilages. Heart: direct overpressure plus a vascular pressure wave and coronary air embolism → myocardial injury and hemopericardium. Brain: the thoracic pulse surges through the great vessels into the cerebral circulation → subarachnoid hemorrhage. That last link is the keystone — it explains how a chest insult produces a brain bleed.
What the literature also cautions — stated plainly
The strangulation look-alike. Laryngeal cartilage fractures are classically linked to strangulation. The blast literature itself (Galante 2021) warns this can be reproduced by an explosion — and the 284-case baseline (de Bakker 2021) shows cricoid fractures are rare in strangulation, which is what tips multi-site cricoid + tracheal disruption toward a high-energy / barotrauma cause.
The blood-surge mechanism is supported but debated. The thorax→brain pressure surge is well established hemodynamically (Simard 2014; Assari 2013), but whether the surge alone is sufficient to cause tissue-level brain damage remains contested (Rubio 2020; Miller 2021 note negligible modeled tissue strain). Best presented as one of several converging mechanisms, not a settled certainty.
Analogous vs. direct sources. Reference 11 (a fetal hydrostatic “blast”) is flagged in red because “blast” there means a transmitted pressure wave rather than an explosion. It is shown for mechanism and cited with that framing.
// Every citation above is a real, peer-reviewed source; each link resolves to PubMed, the publisher, or an authoritative body (CDC, National Academies). This section summarizes published injury mechanisms and how a documented constellation of findings maps onto a primary blast injury pattern — a forensic-literature analysis of an injury pattern, not a determination about any individual, which remains the province of qualified medical examiners and the courts. // sources verified · no trust required · follow the links
Section 17 — Cervical Reach Analysis
Can the stated trajectory reach the findings?
A wound trajectory is a line in three dimensions. Whether it can have caused a given injury is partly a question of geometry, answerable before any question of mechanism arises. Two independent tests are applied here — one in the vertical plane, one in the horizontal. Both use the same two measurements: a descent of 9.4° taken on site, and a horizontal deviation of approximately 8° from the sagittal plane read off an anatomical section overlay at C6.
What this is — and is not. This is a geometric test of reach, nothing more. It asks only whether a line on the stated bearing arrives at the anatomical structures described. It does not identify what caused any injury, and every figure below is reproducible by plane trigonometry from the inputs listed. Anatomical values are population-typical rather than subject-specific, and the trajectory figures are as supplied, without stated instrument tolerance.
16.1 — Inputs
Trajectory depression, measured on site9.4°
Horizontal deviation from sagittal, from section overlay≈ 8°
Entry — lower quarter of Zone II, anterolateral≈ C5–C6
Cervical level height, vertebral body plus disc≈ 1.7 cm
Neck anteroposterior depth at C6≈ 10.5 cm
Carotid sheath, lateral offset from midline≈ 3.5 cm
Spinal cord, posterior offset from sheath≈ 4.5 cm
16.2 — Vertical plane
C1 unreachable by 46.3° of arc
Cord damage described from C1 through C7 spans the full cervical column. From an entry at C5–C6, C1 sits roughly 9 cm higher. A track descending at 9.4° moves away from it throughout its course — reaching C1 would require a 36.9° ascent, a divergence of 46.3° from the measured line.
Solid red, the measured track. Dashed amber, the path required to place the projectile at C1 from the same entry. Vertebral spacing at 1.7 cm per level.
The trajectory is measured against the horizontal; the anatomy against the body axis. Forward lean converts between them, so the test is how much lean would be needed before the track could ascend at all. The seated posture in the footage is near-vertical.
Forward lean
Track in body frame
Rise across 12 cm
Reaches C1?
0°
9.4° descending
−2.0 cm
No
5°
4.4° descending
−0.9 cm
No
9.4°
level
0.0 cm
No
15°
5.6° ascending
+1.2 cm
No — 7.8 cm short
46.3°
36.9° ascending
+9.0 cm
Yes
16.3 — Horizontal plane
Cord missed by ≥ 21° at every plausible entry
An independent test in a second plane. From an anterolateral entry at the carotid sheath, reaching the cord requires substantial medial angulation — between 29° and 45° depending on exactly where the entry sits. The measured deviation is approximately 8°, and on that path the track passes roughly 2.9 cm lateral of the cord.
Schematic, not a radiological image; structure positions are population-typical. The measured track passes lateral to the vertebral body and cord, through the sheath and into the scalene and brachial plexus region.
16.4 — Where the track ends
A path deviating only 8° from the sagittal plane runs front to back rather than downward through the body. Across the anteroposterior depth of the neck it descends about one vertebral level and exits posteriorly. It does not turn toward the thoracic inlet.
Descent across the 10.5 cm anteroposterior traverse1.74 cm ≈ 1 level
Medial drift across the same traverse1.48 cm
Exit level≈ C6–C7, posterolateral
Travel required to descend from C6 to T120.5 cm
Travel required to descend from C6 to T5 — pericardial level61.6 cm
16.5 — What this predicts
A geometric result earns its place by predicting positively, not only by exclusion. Each of the following is checkable against the primary record, and each can falsify the analysis.
Laryngotracheal injury. The entry sits just above the cricoid, and a near-sagittal anterior path passes directly through the laryngotracheal complex. Disruption of the thyroid, cricoid and tracheal cartilages is what this trajectory predicts — and it is the one finding in Section 16 that lies squarely on the track.
Brachial plexus injury. The roots are C5–T1 and at this level sit directly in the path, in the scalene interval the track crosses after the carotid sheath.
Exit wound at C6–C7, posterolateral — roughly one vertebral level below entry. Absence of both an exit and a retained projectile would contradict this reconstruction.
Cord intact at the level of entry. The most direct test of the horizontal-plane result: a cord lacerated at C6, or dural laceration at any level, would falsify it outright.
Section 18 — Convergence
Two methods, tested against the same findings
Section 16 asked what the published literature documents for each finding. Section 17 asked whether a line on the stated bearing physically arrives there. The two are independent — one is a literature review, the other plane trigonometry — and they can be laid against each other finding by finding.
Read this table for what it is. The middle column reports reach. The right column reports whether the finding has documented precedent from a mechanism involving no projectile path at all — not whether any particular source produced it. Precedent for a mechanism class is not identification of a cause.
Finding
On the measured track?
Travel required vs available
Non-track precedent documented?
Laryngotracheal cartilage disruption
Yes
Entry level — on the path
Also documented for blast
Bilateral pulmonary hemorrhage, apices
No
20.5 cm to T1 vs 10.5 cm, plus midline crossing
Yes — autopsy-proven with intact chest wall
Bilateral hemothorax
No
20.5 cm vs 10.5 cm, plus midline crossing
Partial — bilateral pleural involvement yes, hemothorax not itemised
Hemopericardium
No
61.6 cm vs 10.5 cm
No — the one finding with no non-track precedent
Bilateral intercostal hemorrhage
No
20.5 cm vs 10.5 cm, plus midline crossing
Yes — rib-level injury with no external wound
Subarachnoid hemorrhage
No
Track descends away from the cranium
Yes — intracranial hemorrhage with no head wound, by two routes
17.1 — What the two agree on
The trajectory accounts for the neck, not the chest. Laryngotracheal disruption lies on the path. The four thoracic findings do not, and the shortfall is not marginal — reaching the pericardium would take roughly six times the distance the neck offers.
A non-track mechanism is not exotic. Four of the six findings have documented precedent from mechanisms involving no projectile path. The alternative to a track explanation is an established category in the literature, not a hypothetical one.
Neither identifies a cause. Both tests are exclusions, and precedent for a mechanism class is not identification of a source. No single mechanism examined accounts for all six findings.
Hemopericardium remains unexplained. Undocumented for a cervical track, and no autopsy case reporting it from blast was located. It is the weakest element in the constellation and is stated as such.
17.2 — Where this is vulnerable
What the blast literature transfers — and what it does not. It establishes mechanism class: overpressure and transmitted pressure waves are documented to produce pulmonary hemorrhage with an intact chest wall, rib-level injury with no external wound, and intracranial hemorrhage with no head wound. What it does not establish is source magnitude, proximity or geometry. The series documenting bilateral symmetric torso hemorrhage involve whole-body loading, where the pressure field is far larger than the body and both sides of the thorax are loaded at once. Both statements are true at the same time, and the proportionality between any candidate source and those documented series remains a separate open question.
The findings are taken as supplied. Both tests take the autopsy findings as their input, so an error or omission in that list propagates through everything above. Two distinctions matter most. Whether the pulmonary finding is primary parenchymal hemorrhage or aspirated airway blood — aspiration is the documented signature of a wound opening the neck airway, and would move that finding onto the track column. And whether the subarachnoid hemorrhage is convexity or basal — basal distribution is documented for remote gunshot effects, convexity is not. Absence of an indexed publication is also not impossibility: fatal wounds confined to the neck were explicitly too rare to study in the one systematic histologic series available.
Limits. Exclusion is not attribution, and convergence of two exclusions is not affirmative evidence — independent methods agreeing that one mechanism fails does not transfer support to any particular alternative. Anatomical values are population-typical; the trajectory figures are as supplied without stated tolerance. Nothing here bears on identity, intent, or the position of any person, and none of it is a determination of cause, manner or mechanism of death, which remains the province of qualified medical examiners and the courts.
Section 19 — Glass Reflection Analysis
A flash in the glass
A courtyard phone video shows a brief bright event in the glass curtain wall — in the pane to the right of the people standing on the stairs — immediately before the loud report on the audio track. The hypothesis under test: that this is the muzzle flash of the shot, reflected in glass approximately 12 ft above a surveyed ground point, originating at the shooter position established independently by acoustic analysis of the Canon XA55 recordings.
The same position has independent eyewitness support: a witness standing between it and the courtyard area where the Mach cone was recorded reported the courtyard tree’s leaves shredded to “confetti” and felt the rifle blast. This section tests the optical hypothesis three separate ways — whether the law of reflection permits the sight line at all, whether the required mirror orientation matches the actual glass at the pinned location, and whether the flash-to-sound timing matches the distances the geometry demands.
Preliminary — pending original unedited source clip
What is input, and what is result. The three pin positions and the ~12 ft reflection height are inputs, not products of this analysis. Altitudes are Google Earth terrain values and carry meter-scale uncertainty. The clip is a re-encoded InShot edit, so audio/video sync is trusted only to about one frame (±33 ms). Everything below derives from those three raw inputs by plane geometry and signal measurement; nothing is synthetic.
18.1 — Inputs
Shooter position (KML)40.2781068°N 111.7124909°W · 1414.81 m
Camera position (KML)40.2776918°N 111.7140791°W · 1401.26 m
Glass reflection base point (KML)40.2773737°N 111.7139623°W · 1401.67 m
Stated reflection height above that point12 ft
Aerial reference — facade bearing only, georeferenced against the pinsGoogle Earth 3D
Video — InShot export of the phone original, AAC 44.1 kHz stereo0.638 s · 21 frames · 29.97 fps · 1080×1350
18.2 — Reflection geometry
All positions were converted to a local east-north-up frame centred on the reflection point (glass pin + 12 ft). From there the shooter position lies at azimuth 57.0°, elevation +3.6°, range 149.6 m (491 ft) — 9.5 m above the glass, consistent with an elevated firing point. The camera lies at azimuth 344.3°, elevation −6.3°, range 36.9 m (121 ft). For a specular path from flash to camera the glass normal must bisect those two directions, and that bisector is unique.
Quantity
Value
Required glass facing (normal azimuth)
20.7° NNE — glass plane running 110.7°/290.7°
Required lean from plumb at 12 ft
1.7° — essentially vertical architectural glass; a perfectly plumb pane solves exactly at ≈7 ft reflection height
Angle of incidence = angle of reflection
36.6°
Camera sight line to the reflection
azimuth 164.3°, elevation +6.3°
Camera direct line to shooter position
azimuth 71.2°, elevation +5.4°, 143.4 m
Sensitivity
facade azimuth shifts ~1–2° per few metres of pin error; required lean changes 0.36° per ft of reflection height
Fig. 18.1 — Top-down reflection geometry, north up, local ENU frame at the reflection point. Solid red: flash to glass. Dashed red: glass to camera. Cyan: the one glass orientation that satisfies the law of reflection.
Any single point can be “explained” by a mirror at some orientation. The number that matters is whether azimuth 20.7° matches real glass at that spot — and that is testable.
18.3 — Does the actual facade match?
The aerial capture was georeferenced using the three KML pins themselves as ground-control points, solving the exact affine transform. The recovered transform puts north within 0.6° of image-up at a scale of 8.0 px/m, confirmed against the 90 m scale bar. The required glass plane was then projected onto the imagery at the pin.
Fig. 18.2 — Ray path and required glass-plane orientation projected onto the georeferenced aerial capture. Red: flash ray in. Dashed red: reflected ray to camera. Blue: required glass plane. Click to enlarge.
Facade matches within measurement uncertainty
Finding. The wall at the pinned location — the NE-facing wall with glass doors at the SE end of the covered walkway — measures at bearing ≈115–125° in the georeferenced imagery, i.e. facing ≈25–35°. The reflection solution requires facing 20.7°. Agreement is within the combined measurement uncertainty of 3D-mesh distortion, ±5° edge picking, and metres of pin tolerance.
Excluded. The white-roofed building’s NW wall southeast of the pin faces ≈344° and cannot produce this reflection under any plumb-glass configuration. The geometry therefore discriminates between the candidate surfaces at the site — and selects the one the pin sits against.
A reverse ray-trace was run as a cross-check. Assuming perfectly plumb glass on that wall at facings of 18–24°, the mirror image of a flash at the shooter position lands 6.8–7.8 ft up the glass, within ~4 m of the pin. Reconciling that with the reported ~12 ft requires either ~1.7° of pane lean or ~1.5 m of error in the pin’s terrain altitude — both inside normal tolerance for construction and for Google Earth elevations. The plumb-glass solution predicts the flash image at roughly 7–8 ft; ground-truth photos of the pane height would refine this.
18.4 — The flash in the video
Frame-by-frame differencing — each frame against the average of its neighbours, motion-checked — isolates exactly one transient in the glass region across the 21-frame clip: a compact, roughly round brightening confined to a single pane, in frame 5 only (133–167 ms; rolling-shutter row timing places capture at ≈141–166 ms). It is absent in frames 4 and 6.
Fig. 18.3 — Frames 4/5/6 with the flash circled, the ×12-gain difference image isolating it, and the audio envelope with the three timing markers. Click to enlarge.
Property
Measurement
Reads as
Duration
1 frame (≤33 ms)
brief source; muzzle flashes last ~1–5 ms
Shape
compact round core ≈40 px + faint vertical wisp
point-like source spread by insulated-glass-unit distortion and encode bloom
Extent
confined within one pane, crisp at the mullions
the light is in the glass — a reflection, not an event in front of it
Colour
neutral white: +20/+20/+20 RGB over background
white light source; not a warm glint or a coloured object
Intensity
max R99 G115 B131 — far from clipping
a millisecond flash partially caught by a short daylight exposure through tinted glass
Difference signature
no adjacent darkening in frame 5
something appeared and vanished; not a reflected object moving between panes
18.5 — Timing: light, crack, report
The clip’s audio contains two shot-related events. Sound #1, onset 301.6 ms (+161 ms after the flash): a ~80 ms swell, energy below 3 kHz. Sound #2, onset 584.3 ms (+443 ms): the loudest event in the clip, sub-millisecond attack, mid-high dominated with 63% of its energy in 1.5–6 kHz, with a trailing impulse 14–17 ms later consistent with a nearby-surface echo.
Ordering constraint. A ballistic crack cannot arrive after the muzzle report at any observer: the crack generated at downrange point s arrives at s/vb + r(s)/c, which at s = 0 reduces to the report itself, and a supersonic bullet only improves on that. The loud terminal event at 584 ms is therefore the muzzle report, and the Mach-cone crack must sit earlier — where sound #1 is.
Interval
Measured
Predicted from the KML pins
Flash → muzzle report
443 ± 20 ms — ≈148–155 m acoustic at 343–349 m/s
143.4 m ⇒ 411–418 ms — agreement within the ±1-frame A/V sync tolerance of the edited clip
Flash → crack (sound #1)
+161 ms
requires a supersonic projectile terminating near the camera; with impact ~135–140 m downrange and closest approach 3–15 m from the camera, implied projectile speed ≈900–1100 m/s — rifle-class, and a data-derived constraint on a velocity previously carried as an assumption at 800 m/s
Report echo spacing
14–17 ms
≈5–6 m of extra path — a facade within ~3 m of the camera’s sight line
Finding. The clip contains the complete three-part gunshot sequence — light, ballistic crack, muzzle report — in the correct order and at spacings that match the KML shooter position. The flash is simultaneous, within one frame, with the acoustically back-computed trigger time, and the flash-to-report interval independently returns the camera-to-shooter distance to within the sync tolerance of the edited clip. A coincidental light source — a photographer’s strobe, a sun glint, a moving object — cannot manufacture matched acoustics keyed to its own frame.
18.6 — Conclusions
The bright event in frame 5 is optically and acoustically consistent with the muzzle flash of the shot, reflected in the glass at the pinned location. The law-of-reflection solution requires near-plumb glass facing 20.7°; the actual wall at the pin faces ≈25–35° within measurement error while the neighbouring facade is geometrically excluded; the flash’s appearance matches a brief white source mirrored in an insulated glass unit; and the flash–crack–report timing reproduces the surveyed camera-to-shooter distance. No tested alternative explains all three independent lines at once.
The reflection constrains a line, not a point. Any flash along the ray leaving the glass at azimuth 57°/+3.6° reflects identically. Range along that line comes from the acoustics and the independent Canon work — not from the optics.
Sound #1 as the crack is probable, not certain. Its spectrum is low-passed by the clip’s heavy AAC re-encode — no content above ~6 kHz survives in that event — and possibly by device limiting. The flash-to-report match stands on its own regardless.
All timing inherits ±1 frame of sync uncertainty from the InShot export. The original unedited camera file would collapse most of it, and would also give millisecond flash timing and the lens FOV needed for absolute sight-line angles.
Two ground measurements would harden this. A surveyed bearing of the glass wall — predicted at 110.7°/290.7° along the pane — and photos establishing the reflective pane’s actual height, where the plumb-glass solution predicts the image at ~7–8 ft.
18.7 — Method & reproducibility
All results derive from the three raw inputs in 18.1. Reproducible with ffmpeg, Python 3, numpy and Pillow:
Parse the pin coordinates from the KML and convert to a local ENU frame at the reflection point, using WGS-84 degree lengths at 40.28°N: 111,132 m/° latitude, 85,000 m/° longitude.
Solve the reflection: normalise the vectors reflection→shooter and reflection→camera; their normalised sum is the required mirror normal; the incidence angle follows from the dot product.
Georeference the aerial capture by solving the exact 2×3 affine from the three pin pixel positions to ENU; validate against the scale bar and north; project the required plane and measure facade bearings.
Demux the clip with ffmpeg into 21 frames plus PCM audio. Locate transients by per-frame luminance differencing against neighbour-frame averages; isolate the flash via f5 − (f4+f6)/2; measure RGB deltas and extents.
Audio: 1 ms max-abs envelope for event onsets at a 25%-of-peak threshold; band energy by FFT for spectral character; convert intervals to path lengths at 343–349 m/s.
Limits. This exhibit tests the physical consistency of surveyed positions against recorded media. It does not by itself establish the identity of any person, and it is preliminary pending the original unedited source clip. The pin positions and the 12 ft height are supplied inputs carrying meter-scale uncertainty; consistency with them is not independent confirmation of them.
Section 20 — The Evidentiary Record
What is proven, what is inferred
A category-by-category review of the State’s evidence — drawn from the sworn probable-cause affidavit, the charging Information, the unsealed ATF report, and statements made on the record in open court. Each item is graded by what the primary record actually establishes, against what rests on inference, characterization, or contested data the defense has not yet been able to examine.
What this is — and is not. This is an analysis of evidentiary weight and gaps, not a determination of guilt or innocence. “Inferred,” “contested,” and “unverified” do not mean “false.” Every grade below is anchored to a public primary document or an attributed on-the-record statement. Where the record is silent, that silence is noted as a gap — suggestive, not dispositive, given that discovery in this case reportedly exceeds 600,000 files.
FilterAllRecord establishesInferred / contestedRecord does not show
Record Establishes
The Event
ShowsA single shot struck Charlie Kirk in the neck at ~12:23 p.m. on Sept. 10, 2025 — witnessed by thousands and captured on multiple recordings.
ShowsSurveillance filmed a figure in dark clothing crouch, then lie prone at the Losee Center roof edge with a line of sight to the courtyard. Not in dispute.
Record Establishes
The Recovered Weapon
ShowsA scoped Mauser 98 .30-06, wrapped in a towel, was recovered in the wooded strip along the northbound route. The rifle tested operable.
ShowsATF matched the fired casing found with it to that rifle. (Whether it fired the fatal bullet is a separate, unresolved question — see Ballistics.)
Inferred / Contested
Confession Texts & Discord
ShowsMessages describe non-public detail — a rifle drop point, leaving it wrapped in a towel, engraving bullets, changing outfits.
ButPhotographed off the roommate’s screen, not forensically extracted; sender identified only as the contact name “Tyler”. Discord told USA TODAY the rifle messages were not sent on its platform.
Inferred / Contested
DNA “Consistent With Robinson”
ShowsState asserts DNA consistent with Robinson on the trigger, fired casing, two unfired cartridges, towel, and screwdriver.
ButLead defense counsel stated in court the scene DNA is a mixture of at least five individuals. Defense has summary reports only — not the raw data. No contributor count or statistical model is public.
Record Does Not Show
Ballistics — the Fatal Bullet
ShowsATF identified the fired casing as fired in the recovered rifle. Rifle tested operable.
GapThe autopsy bullet was inconclusive — “could not be identified or excluded.” No casing was recovered at the rooftop, and no test dates any firing. FBI re-analysis incomplete.
Record Does Not Show
Identity of the Shooter
GapThe affidavit concedes the figure’s face was never clearly captured (cap, sunglasses, head down). No facial-recognition match. No eyewitness facial ID.
Rests onFamily likeness recognition of released images, the confession, and DNA on recovered items — not a visual identification.
Record Does Not Show
The Clothing Change
GapNo camera captured a clothing change. Nothing independently ties the dark-shirt rooftop figure to Robinson’s filmed maroon-outfit arrival that morning.
Rests onAn inference, plus a reference in the contested texts (“where I changed outfits”).
Record Does Not Show
Rifle on the Rooftop
GapNo camera identified a rifle — before, during, or after. The affidavit’s fleeing object is “an item, whose identity is not clear from the surveillance.”
NoteLater coverage upgraded this to “what appeared to be a rifle” — a characterization drift from the sworn wording. (No roof casing is expected: the Mauser is bolt-action.)
Record Does Not Show
Rifle Deposit in the Woods
GapSurveillance stops at the road crossing, then switches to “investigators discovered” the rifle. No footage shows the figure reaching, entering, or depositing it in the treeline.
Rests onDirection of travel plus the contested texts — not footage of the act.
Inferred / Contested
The Screwdriver (Rooftop Anchor)
ShowsState’s strongest rooftop tie: DNA said to match Robinson on a screwdriver recovered from the roof.
ButAbsent from the charging Information. Touch DNA on a portable object proves contact at an unknown time — not presence at 12:23 p.m. Function and exact location never explained. Falls inside the five-contributor mixture problem.
Record Does Not Show
Fingerprints & Palm Print
ShowsPrints and a smeared palm print found at the northeast rooftop edge; used as a DNA source.
GapNo friction-ridge identification of Robinson disclosed; no disclosed DNA match from the prints. The shoe impression is a Converse class match — not individualizing.
Record Does Not Show
Cellphone Location Data
ShowsPhone location data and a Google Maps route place Robinson’s device near campus on Sept. 10.
GapDoes not place the phone on the rooftop or fix it to 12:23 p.m. — ties the device, not necessarily the person, to the area at unspecified times.
Inferred / Contested
Custody & the Discord Timeline
IssueA defense filing reportedly shows Miranda read 6:25 p.m. with counsel invoked — predating the 8:57 p.m. Discord “surrender” post and the 10 p.m. booking. The affidavit’s own arrest field reads 04:00 the next day.
OpenAt least three inconsistent custody times. Innocent explanations (clerical, jurisdictional, time-zone) remain unresolved. Primary transcript not yet public.
Record Does Not Show
Gunshot Residue
GapNo GSR test appears anywhere in the public record. GSR cannot date a firing or identify a shooter in any event.
15.1 — The Chain of Inference
The State’s narrative is a sequence of links. Several of the load-bearing ones are established by inference or contested data rather than by direct, individualizing proof. Isolated, in order:
01
Phone near campus → “Robinson at the scene”
Location data ties a device, not a person, to the area — not the rooftop, not 12:23 p.m.
02
Rooftop prints → Robinson
The prints carry no disclosed friction-ridge ID and no disclosed DNA match. The lone roof item the State claims is the screwdriver — contested and undateable.
03
Clothing change → same person
No footage of any change. The dark-shirt figure and the maroon-outfit arrival are joined only by inference and the contested texts.
04
Family recognition → identification
Relatives thought they recognized released imagery. Unknown which images; no direct sworn statement — only a law-enforcement paraphrase.
05
“DNA consistent with Robinson” → clean attribution
In a mixture of at least five individuals (per defense counsel, in court), “consistent with” carries the least individualizing weight — and “astronomical odds” can’t be tested without the undisclosed contributor count and model.
06
Rifle → rooftop, and Robinson → the drop site
No footage or physical evidence puts the rifle on the roof or shows Robinson reaching the woods. Both links are directional inference plus contested texts.
07
Limp & shoe print → identity
The gait was only “consistent with” a concealed rifle — unique to no one. The Converse sole is a class match, not an individualizing print.
15.2 — On the Record
“DNA evidence that was seized from the scene consisted of a mixture of at least five different individuals.”
Kathryn NesterLead defense counsel, open court, Feb. 2026 · reported by The American Prospect
The autopsy bullet “could not be identified or excluded” as fired from the recovered rifle.
The fleeing suspect “appeared to be carrying an item, whose identity is not clear from the surveillance.”
Probable-Cause AffidavitSworn by Officer Brian Davis, Utah AG · Sept. 12, 2025
Read Before Citing
This is a weight-and-gap analysis, not a verdict. The strong evidence (confessions; DNA on the recovered rifle and towel along the escape path) ties Robinson to the weapon and to the event — the contested question is whether it independently places his body at the shooting position at 12:23 p.m.
Some anchors are as-reported, not yet as-read. The 6:25 p.m. Miranda transcript and the per-item DNA contributor data have not been verified against released primary documents.
A probable-cause affidavit is a summary. Its silences are suggestive, not dispositive; full discovery may fill gaps in either direction.
Every claim here is sourced. This page deliberately excludes unverifiable, conspiracy-adjacent assertions in favor of primary documents and on-the-record statements.
SOURCES: Charging Information (Utah County Atty.) · Redacted PC Affidavit · ATF Firearms Report · Defense Motion to Continue (Mar. 2026) · In-court statements, Jan–Apr 2026 hearings. | Graded from primary documents only.
Section 21 — Verify It Yourself
No trust required
Every claim on this site can be independently verified. Below are the original, unmodified source video files from six cell phone cameras, plus the complete Python analysis script. Download them. Run the code. Check our work. The science either holds up or it doesn’t — and we want you to find out for yourself.
The analysis requires Python 3.8+, numpy, scipy, matplotlib, and ffmpeg. Place the video files in a videos/ folder and run the script. It will extract audio, bandpass filter into five signature bands, perform onset detection, TDOA multilateration, stereo ILD analysis, cavitation pulse detection, and Strouhal verification — all automatically.
Six cell phone recordings from the UCCU Center courtyard. These are the original, unmodified files. Each contains synchronized audio and video tracks. Together they provide the multi-angle acoustic data for TDOA source localization.
2.mov
iPhone 15 Pro • 59.94fps • 44.1kHz stereo • Closest to van position (6.4m). Strongest 4940Hz detection (+12.7dB L-channel). Primary cavitation pulse camera.
1. Install dependencies: pip install numpy scipy matplotlib and ensure ffmpeg is in your PATH.
2. Create a folder called videos/ and place all 6 files inside it.
3. Run: python acoustic_fingerprint_analysis.py
4. Results are printed to console and saved as images in results/.
The script uses the same GPS-verified camera positions, event frames, frequency bands, and multilateration algorithm documented in the forensic report. If you get different results, we want to know. Contact: followtheepicenter.com
Section 22 — Full Reports
Download the evidence
★ Reasonable Doubt — The Defense Summary
The hardest evidence that casts reasonable doubt on the official narrative. Canon XA55 audio as centerpiece. The detonation thesis unified with the necklace, shirt deformation, shrapnel, acoustic signatures, 53Hz chest resonance, and decorticate posturing. Start here.
NEW: Canon XA55 — 4-Channel Professional Audio Analysis
Video 15: 4-channel 48kHz uncompressed PCM from a Canon XA55 broadcast camcorder. The strongest acoustic evidence from the event — 733 sub-200µs N-wave zero-crossings (6× phone recordings), three resolved LF events placing the rifle at ~120m, and independent confirmation of every finding from the 10-camera analysis. Interactive visualizations generated from raw source audio.
An interactive aerial map of the UCCU Center courtyard built from authoritative GPS coordinates. Eleven recorder positions, four acoustic sources, and animated wavefront propagation at 343 m/s. Click any pin to see precise arrival times for every signature. Press play to watch the Mach cone, muzzle blast, stage detonation, and 4940Hz Strouhal tone propagate across the actual scene geometry. The clearest visual explanation of the timing evidence available.
Three peer-reviewed hydrodynamic models — Comiskey/Yarin/Kim/Attinger 2016 back spatter, Comiskey/Yarin/Attinger 2017 forward spatter, and Bernoulli–Torricelli vascular flow — predict three independent observables for a real .30 caliber rifle round to a vascular neck target: a dense back-spatter halo on the entry shirt, a forward-spatter cone on the downstream backdrop, and visible bleeding within 4–14 ms. Frame-by-frame analysis of video2_1.mp4 shows 429–461 ms onset, 30× to 110× longer than physics predicts. All three signatures are absent. Full Python pipeline downloadable for independent verification.
Standalone Exhibit — Five datasets, four methods, two opposition reports. All findings cross-validated. Includes muzzle blast comparison, detonation timeline, 4940Hz coherence proof, and the 192m-underground stationary model result.
Standalone Exhibit — FA-2026-002. Full standardized 10-phase forensic acoustic methodology applied to the UCCU dataset. Intake through reporting, with cross-validation against Maher (CNN), Ken Linke 21-recorder set, Canon XA55 PCM, and FR05m mic.
Analysis of the Canon XA55 48kHz uncompressed PCM recording shows the muzzle blast arriving at +202 ms after the bullet crack. A specific alternate shooter position advanced during the case, when propagated through the crack-boom geometry, produces a maximum possible interval of 159 ms at the Canon — a 43 ms gap that no geometry closes. This finding is derived from four internally consistent acoustic lines — TDOA multilateration, crack-boom timing across the Ken Linke 21-recorder set, the Canon XA55 PCM interval, and N-wave zero-crossing analysis. Dr. Rob Maher's independent CNN analysis places the shot at approximately 150 m in the Losee direction, broadly consistent with the FBI's identified rooftop position — providing independent third-party corroboration that the shot was a supersonic rifle round from the Losee direction, not an endorsement of the specific 43 ms gap finding, which is this analysis's own contribution.
Three independent camera angles document the trajectory of a 32-gram stainless-steel necklace during the September 10, 2025 incident. The chain travels upward from its rest position at the neckline, passes over the back of the head, and settles draped across the left shoulder — a trajectory that requires an impulse with both vertical and posterior horizontal components. A single broken link departs forward in the opposite direction, the conservation-of-momentum signature of an internal energetic source. Both observations are independently inconsistent with the prosecution's horizontal-bullet-impact mechanism.
Medical examiner findings — bilateral hemothorax, hemopericardium, bilateral apical pulmonary hemorrhage, intercostal hemorrhages, tracheal cartilage disruptions, and intracranial subarachnoid hemorrhage — are evaluated against two competing hypotheses: a .30-06 rifle shot entering the neck and a shaped charge detonation on the chest. Helmholtz lung cavity resonance at FRC (~3 L) predicts 47–58 Hz; the observed 53 Hz peak falls at the center. Cooper’s blast injury framework (1991) and Courtney’s thoracic vascular surge mechanism (2009) independently explain the intracranial findings. The shaped charge hypothesis explains 13 of 13 findings from first principles; the rifle requires secondary mechanisms for 7 of 13.
A courtyard phone video shows a single-frame white flash inside one pane of the glass curtain wall, immediately before the loud report. Three independent tests: the law of reflection requires glass facing 20.7° and the wall at the pinned location faces ≈25–35° while the neighbouring facade is geometrically excluded; the flash reads as a brief white point source mirrored in an insulated glass unit; and the flash–crack–report timing reproduces the surveyed camera-to-shooter distance of 143.4 m. The crack interval also yields a data-derived projectile speed of ≈900–1100 m/s, replacing the 800 m/s figure carried as an assumption. Preliminary pending the original unedited source clip.